. 2003 Oct;77(19):10488-503.
doi: 10.1128/jvi.77.19.10488-10503.2003.

Transcription program of murine gammaherpesvirus 68

Affiliations
Free PMC article

Transcription program of murine gammaherpesvirus 68

DeeAnn Martinez-Guzman et al. J Virol. 2003 Oct.
Free PMC article

Abstract

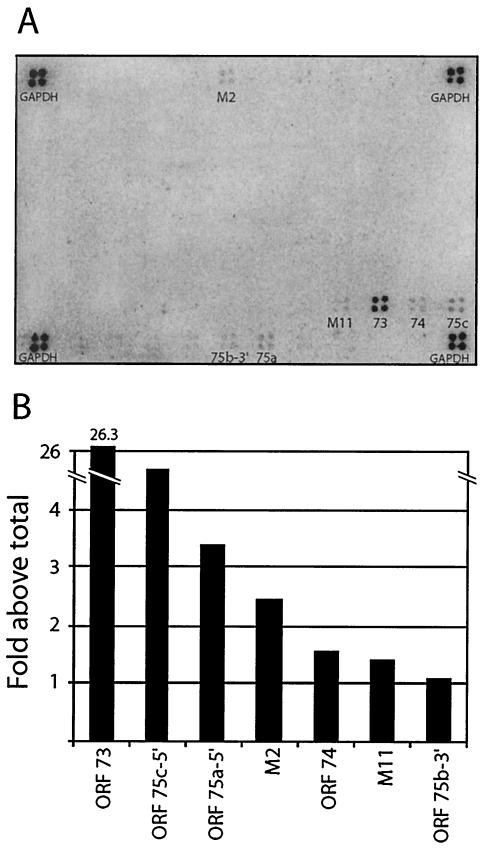
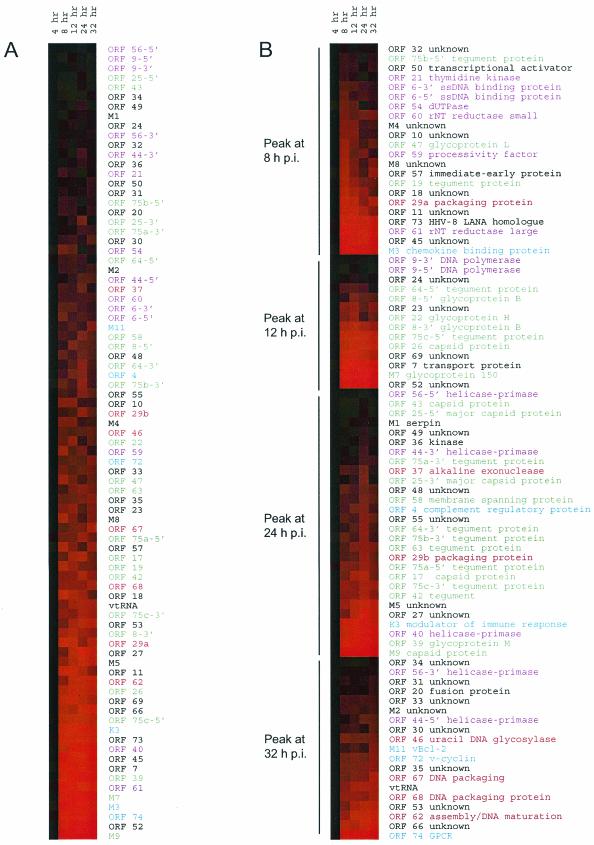
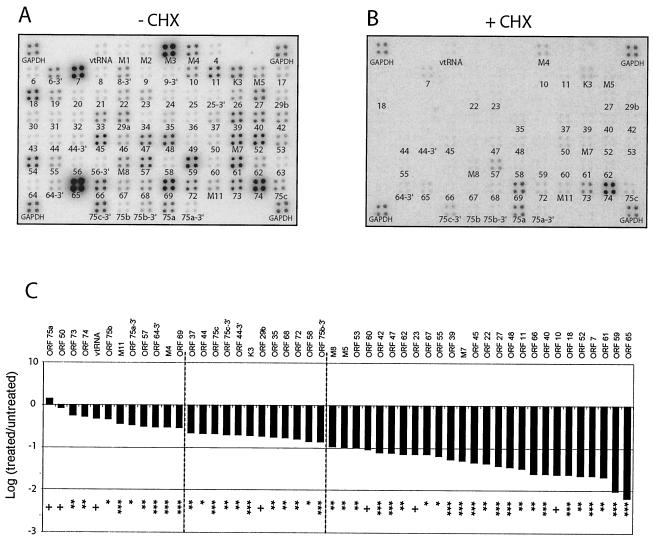
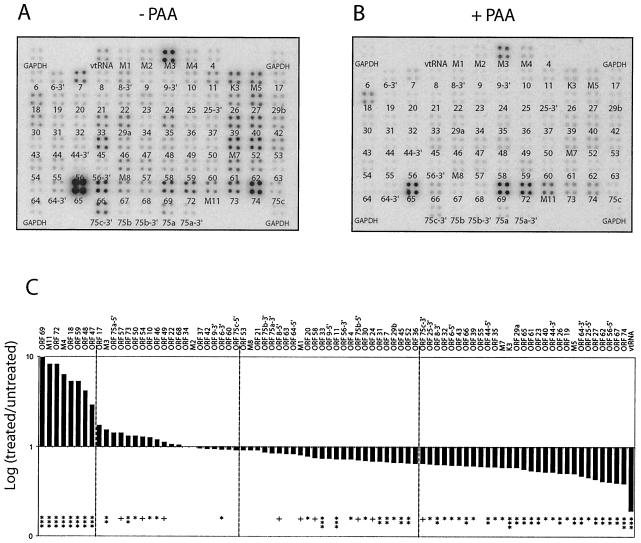
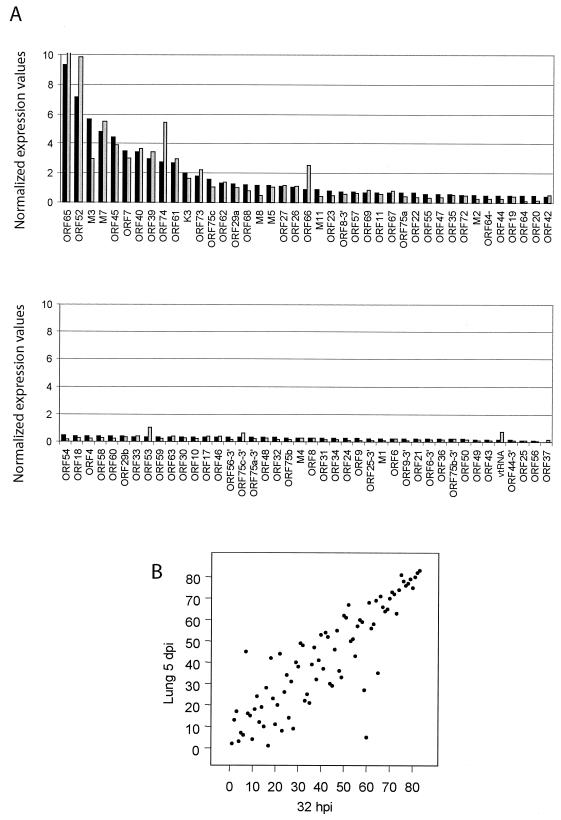
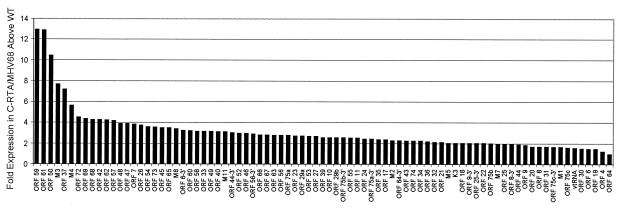
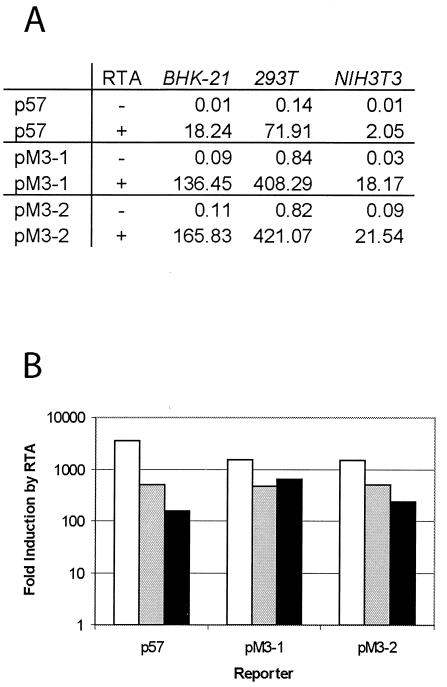
Murine gammaherpesvirus 68 (MHV-68 [also referred to as gammaHV68]) is phylogenetically related to Kaposi's sarcoma-associated herpesvirus (KSHV [also referred to as HHV-8]) and Epstein-Barr virus (EBV). However, unlike KSHV or EBV, MHV-68 readily infects fibroblast and epithelial cell lines derived from several mammalian species, providing a system to study productive and latent infections as well as reactivation of gammaherpesviruses in vivo and in vitro. To carry out rapid genome-wide analysis of MHV-68 gene expression, we made DNA arrays containing nearly all of the known and predicted open reading frames (ORFs) of the virus. RNA obtained from an MHV-68 latently infected cell line, from cells lytically infected with MHV-68 in culture, and from the lung tissue of infected mice was used to probe the MHV-68 arrays. Using a tightly latent B-cell line (S11E), the MHV-68 latent transcription program was quantitatively described. Using BHK-21 cells and infected mice, we demonstrated that latent genes are transcribed during lytic replication and are relatively independent of de novo protein synthesis. We determined that the transcription profiles at the peak of lytic gene expression are similar in cultured fibroblast and in the lung of infected mice. Finally, the MHV-68 DNA arrays were used to examine the gene expression profile of a recombinant virus that overexpresses replication and transcription activator (RTA), C-RTA/MHV-68, during lytic replication in cell culture. The recombinant virus replicates faster then the parental strain and the DNA arrays revealed that nearly every MHV-68 ORF examined was activated by RTA overexpression. Examination of the gene expression patterns of C-RTA/MHV-68 over a time course led to the finding that the M3 promoter is RTA responsive in the absence of other viral factors.


Figures

FIG. 1.
FIG. 1.
Latent gene expression profile in S11E cells. (A) MHV-68 membrane arrays were probed with 32P-labeled cDNA generated by RT of poly(A)-selected RNA isolated from latently infected S11E cells. (B) Intensity of signal as a percentage of the average signal across the entire array. The experiment was repeated, and similar results were obtained.
FIG.2.
FIG.2.
Lytic gene expression profile. RNA samples from a time course postinfection of BHK-21 cells were analyzed by membrane array analysis. The data are graphically displayed with color to represent the quantitative changes in RNA abundance. Increases of RNA are shown as deeper shades of red. ORFs are color coded based on functional groups, with purple corresponding to nucleotide synthesis and DNA replication proteins, green corresponding to structural proteins, red corresponding to assembly proteins, blue corresponding to homologues of cellular signaling proteins, and black corresponding to unknown or other proteins. (A) The genes were sorted based on the overall abundance level throughout the course of the experiment. (B) The genes were ordered based on the time at which peak expression is reached and then sorted based on the relative abundance level at the peak of expression. The data are graphically displayed with color to represent the quantitative changes in RNA abundance. Increases of RNA are shown as deeper shades of red. M9, ORF 65.
FIG. 3.
FIG. 3.
MHV-68 gene expression in the absence of de novo protein synthesis. MHV-68 membrane arrays were hybridized with oligo(dT)-primed cDNA synthesized from BHK-21 cells at 8 hpi with MHV-68 at 5 PFU/cell in the absence (A) or presence (B) of CHX. (C) Fold expression of observed transcripts in treated versus untreated samples. A Storm phosphorimager and the ImageQuant system were used to quantitate the signal from the array elements corresponding to 73 known and predicted MHV-68 ORFs. GAPDH-normalized values from the +CHX array (B) were divided by the corresponding GAPDH-normalized values from the untreated (−CHX) array (A) to derive the fold inhibition of gene expression relative to the untreated level for each array element. These values and their corresponding MHV-68 ORFs are ordered in the bar graph based on increasing fold inhibition of gene expression relative to the untreated level. Statistical significance of differences in expression is assessed by paired t test (+, P > 0.05; ✽, P < 0.05; ✽✽, P < 0.01; ✽✽✽, P < 0.001). Dashed lines were placed at the 0.5-log reduction and the 1-log reduction of expression in the presence of CHX.
FIG. 4.
FIG. 4.
MHV-68 gene expression in the absence viral DNA synthesis. MHV-68 membrane arrays were hybridized with oligo(dT)-primed cDNA synthesized from BHK-21 cells at 24 hpi with MHV-68 at 5 PFU/cell in the absence (A) or presence (B) of PAA. (C) Fold expression of transcripts in treated versus untreated samples. A Storm phosphorimager and the ImageQuant system were used to quantitate the signal from the array elements corresponding to 73 known and predicted MHV-68 ORFs. GAPDH-normalized values from the +PAA array (B) were divided by the corresponding GAPDH-normalized values from the untreated array (−PAA) (A) to derive the fold inhibition of gene expression relative to the untreated level for each array element. These values and their corresponding MHV-68 ORFs are ordered in the bar graph based on increasing fold inhibition of gene expression relative to the untreated level. Statistical significance of differences in expression is assessed by paired t test (+, P > 0.05; ✽, P < 0.05; ✽✽, P < 0.01; ✽✽✽, P < 0.001). Dashed lines were placed at 20% reduction and at 30% reduction of expression in the presence of PAA.
FIG. 5.
FIG. 5.
Comparison of the MHV-68 transcription program at the peak of gene expression in vivo and in vitro. Total RNA was harvested from BHK-21 cells at 32 hpi or from the lungs of BALB/c mice at 5 dpi, and labeled cDNA probe was generated for hybridization to MHV-68 membrane arrays. The GAPDH-normalized phosphorimager units for each array element were divided by the total counts across the entire corresponding array. (A) These values and their corresponding MHV-68 ORFs are ordered in the bar graph based on decreasing gene expression levels in the lung (▪) and show the corresponding value in BHK-21 (░⃞). For ease of viewing, the values are illustrated in two graphs. (B) The Spearman rank correlation coefficient was used to assess the relationship between the magnitude of genes expressed in cell culture and in the lung of infected mice at the peak of viral gene expression.
FIG. 6.
FIG. 6.
Gene expression profile of a recombinant MHV-68 overexpressing RTA compared to the parental strain. RNA was harvested from BHK-21 cells at 4 hpi with C-RTA/MHV-68 or the parental strain and labeled cDNA probe was generated for hybridization to MHV-68 membrane arrays. The GAPDH-normalized phosphorimager units for each array element from the recombinant virus array were compared to the corresponding value from the parental strain array. These data are shown graphically to compare each ORF's level of sensitivity to RTA overexpression.
FIG. 7.
FIG. 7.
Analysis of the M3 promoter responsivness to RTA by using reporter assays in BHK-21, 293T, and NIH 3T3 cells. Two regions of the M3 promoter were cloned into a pGL3-Basic vector to drive the expression of firefly luciferase as a reporter. (A) Luciferase activities of reporters cotransfected with pCMV-FLAG (−) or pCMV-FLAG/RTA (+). The M3 promoter constructs were cotransfected into BHK-21, 293T, and NIH 3T3 cells with pCMV-FLAG or pCMV-FLAG/RTA in the presence of a control vector, pRLSV40, that constitutively expresses Renilla luciferase driven by the SV40 promoter. At 24 h posttransfection, cells were harvested and dual luciferase assays were performed. Firefly luciferase activity in reporter constructs was normalized to the corresponding Renilla luciferase activity. (B) Activation of the M3 promoters by RTA in BHK-21, 293T, and NIH 3T3 cells. Fold activation of the reporter by RTA was obtained by comparing the normalized firefly luciferase activity of pCMV-FLAG/RTA-transfected cells to that of pCMV-FLAG-transfected cells. The data are an average of two separate experiments. Bars: □, BHK; ░⃞, 293T; ▪, 3T3.

Similar articles

Cited by

References

    1. Ahn, J. W., K. L. Powell, P. Kellam, and D. G. Alber. 2002. Gammaherpesvirus lytic gene expression as characterized by DNA array. J. Virol. 76:6244-6256. - PMC - PubMed
    1. Chu, S., J. DeRisi, M. Eisen, J. Mulholland, D. Botstein, P. O. Brown, and I. Herskowitz. 1998. The transcriptional program of sporulation in budding yeast. Science 282:699-705. - PubMed
    1. Countryman, J., and G. Miller. 1985. Activation of expression of latent Epstein-Barr herpesvirus after gene transfer with a small cloned subfragment of heterogeneous viral DNA. Proc. Natl. Acad. Sci. USA 82:4085-4089. - PMC - PubMed
    1. Crute, J. J., T. Tsurumi, L. A. Zhu, S. K. Weller, P. D. Olivo, M. D. Challberg, E. S. Mocarski, and I. R. Lehman. 1989. Herpes simplex virus 1 helicase-primase: a complex of three herpes-encoded gene products. Proc. Natl. Acad. Sci. USA 86:2186-2189. - PMC - PubMed
    1. Decker, L. L., L. D. Klaman, and D. A. Thorley-Lawson. 1996. Detection of the latent form of Epstein-Barr virus DNA in the peripheral blood of healthy individuals. J. Virol. 70:3286-3289. - PMC - PubMed

Publication types

LinkOut - more resources