

Recent advances in human quantitative-trait-locus mapping: comparison of methods for selected sibling pairs
- PMID: 12970847
- PMCID: PMC1180608
- DOI: 10.1086/378589
Recent advances in human quantitative-trait-locus mapping: comparison of methods for selected sibling pairs
Erratum in
- Am J Hum Genet. 2004 Nov;75(5):932
Abstract
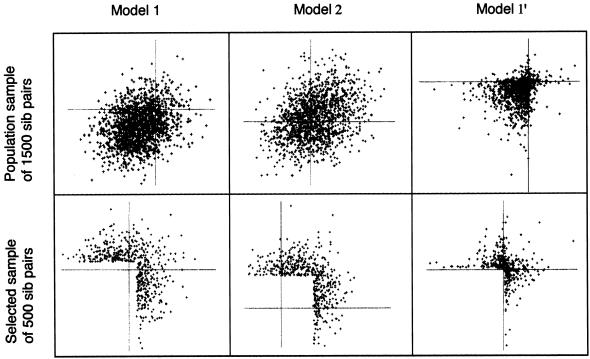
During the past few years, there has been a great deal of new work on methods for mapping quantitative-trait loci by use of sibling pairs and sibships. There are several new methods based on linear regression, as well as several more that are based on score statistics. In theory, most of the new methods should be relatively robust to violations of distributional assumptions and to selected sampling, but, in practice, there has been little evaluation of how the methods perform on selected samples. We survey most of the new regression-based statistics and score statistics and propose a few minor variations on the score statistics. We use simulation to evaluate the type I error and the power of all of the statistics, considering (a) population samples of sibling pairs and (b) sibling pairs ascertained on the basis of at least one sibling with a trait value in the top 10% of the distribution. Most of the statistics have correct type I error for selected samples. The statistics proposed by Xu et al. and by Sham and Purcell are generally the most powerful, along with one of our score statistic variants. Even among the methods that are most powerful for "nice" data, some are more robust than others to non-Gaussian trait models and/or misspecified trait parameters.
Figures
Similar articles
-
Recent advances in human quantitative-trait-locus mapping: comparison of methods for discordant sibling pairs.Am J Hum Genet. 2003 Oct;73(4):874-85. doi: 10.1086/378590. Epub 2003 Sep 10. Am J Hum Genet. 2003. PMID: 12970846 Free PMC article.
-
A powerful and robust new linkage statistic for discordant sibling pairs.Am J Hum Genet. 2004 Nov;75(5):906-9. doi: 10.1086/425523. Epub 2004 Sep 13. Am J Hum Genet. 2004. PMID: 15368196 Free PMC article.
-
QTL mapping with discordant and concordant sibling pairs: new statistics and new design strategies.Genet Epidemiol. 2005 May;28(4):326-40. doi: 10.1002/gepi.20065. Genet Epidemiol. 2005. PMID: 15662636 Review.
-
Composite statistics for QTL mapping with moderately discordant sibling pairs.Am J Hum Genet. 2000 May;66(5):1642-60. doi: 10.1086/302897. Epub 2000 Apr 7. Am J Hum Genet. 2000. PMID: 10762549 Free PMC article.
-
Linkage mapping of quantitative trait loci in humans: an overview.Ann Hum Genet. 2002 Nov;66(Pt 5-6):431-8. doi: 10.1017/S0003480002001240. Ann Hum Genet. 2002. PMID: 12485475 Review.
Cited by
-
Recent advances in human quantitative-trait-locus mapping: comparison of methods for discordant sibling pairs.Am J Hum Genet. 2003 Oct;73(4):874-85. doi: 10.1086/378590. Epub 2003 Sep 10. Am J Hum Genet. 2003. PMID: 12970846 Free PMC article.
-
Theoretical and empirical power of regression and maximum-likelihood methods to map quantitative trait loci in general pedigrees.Am J Hum Genet. 2004 Jul;75(1):17-26. doi: 10.1086/421845. Epub 2004 May 19. Am J Hum Genet. 2004. PMID: 15152343 Free PMC article.
-
Selection of eating-disorder phenotypes for linkage analysis.Am J Med Genet B Neuropsychiatr Genet. 2005 Nov 5;139B(1):81-7. doi: 10.1002/ajmg.b.30227. Am J Med Genet B Neuropsychiatr Genet. 2005. PMID: 16152575 Free PMC article.
-
No "bias" toward the null hypothesis in most conventional multipoint nonparametric linkage analyses.Am J Hum Genet. 2004 Oct;75(4):716-8; author reply 723-7. doi: 10.1086/424754. Am J Hum Genet. 2004. PMID: 15338457 Free PMC article. No abstract available.
-
Influence of genotyping error in linkage mapping for complex traits--an analytic study.BMC Genet. 2008 Aug 25;9:57. doi: 10.1186/1471-2156-9-57. BMC Genet. 2008. PMID: 18721489 Free PMC article.
References
Publication types
MeSH terms
Grants and funding
LinkOut - more resources
Full Text Sources
Miscellaneous
