. 2003 Sep;14(9):3821-33.
doi: 10.1091/mbc.e03-01-0860. Epub 2003 Jun 13.

Histone hyperacetylation in mitosis prevents sister chromatid separation and produces chromosome segregation defects

Affiliations

Histone hyperacetylation in mitosis prevents sister chromatid separation and produces chromosome segregation defects

Daniela Cimini et al. Mol Biol Cell. 2003 Sep.

Abstract

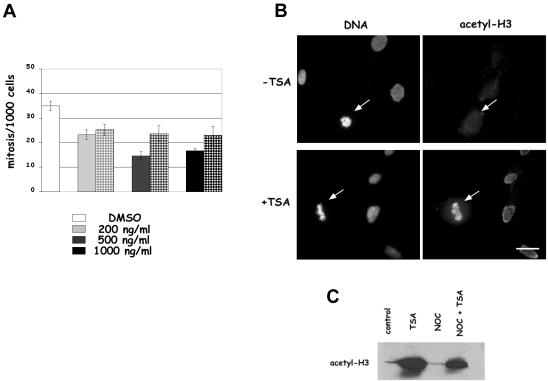
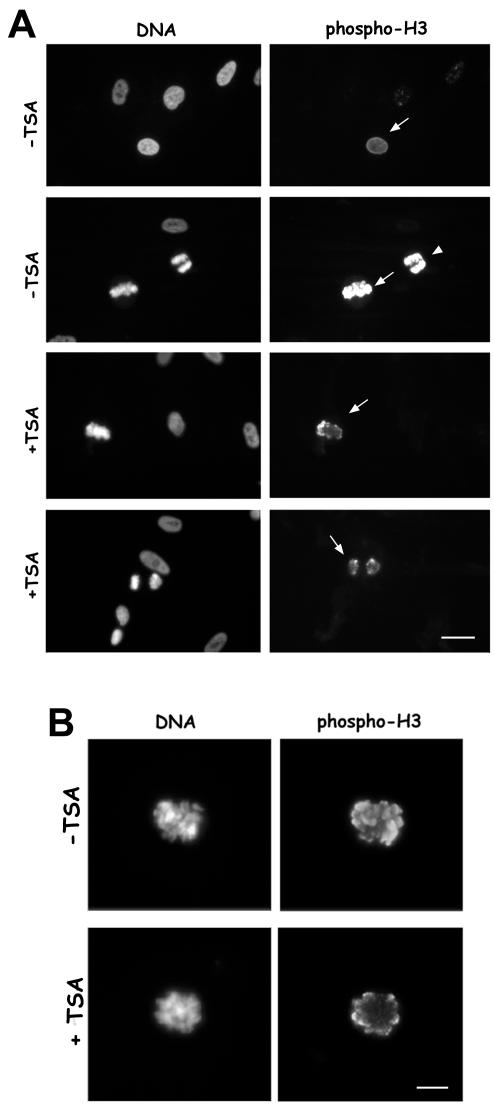
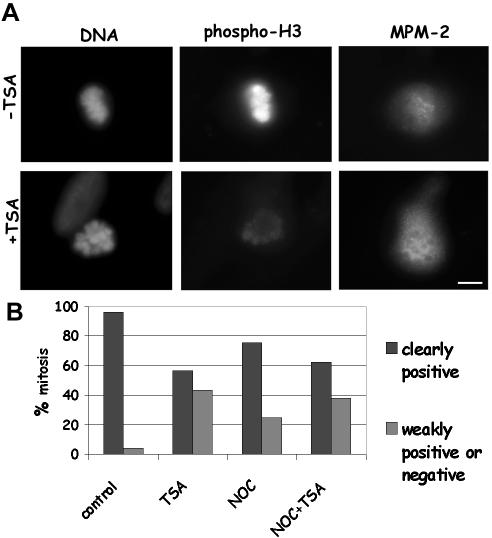
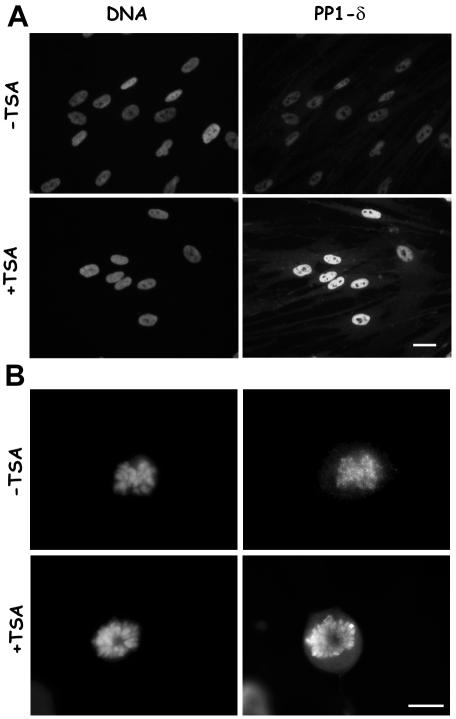
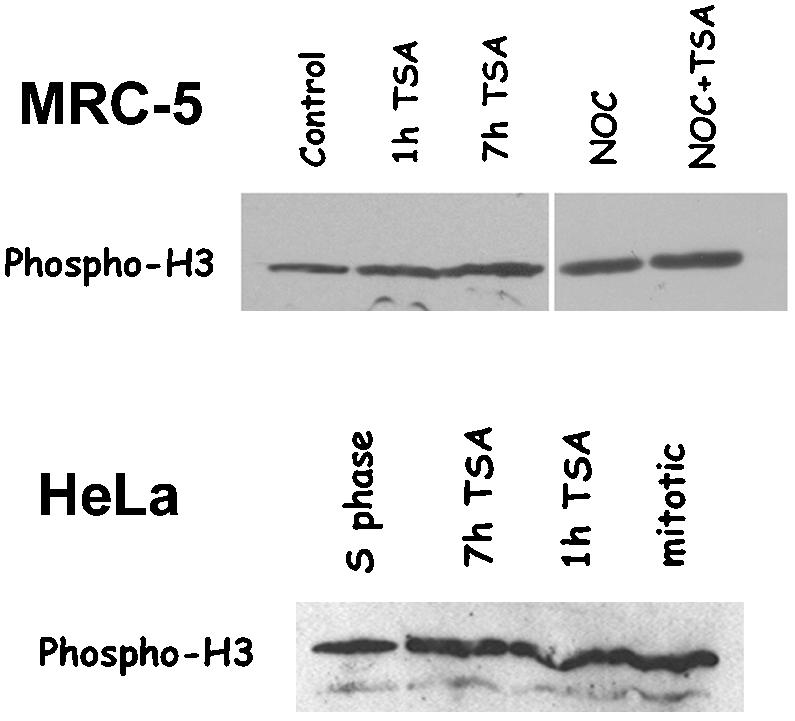
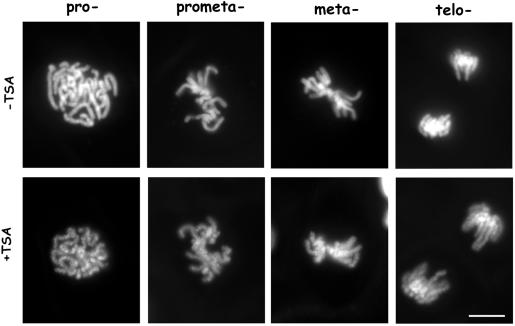
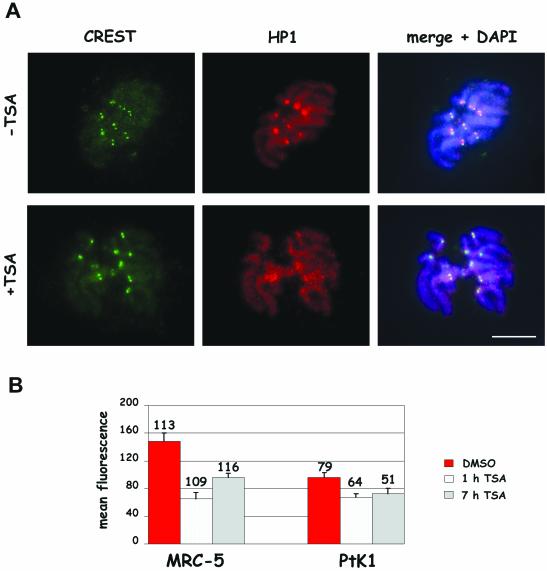
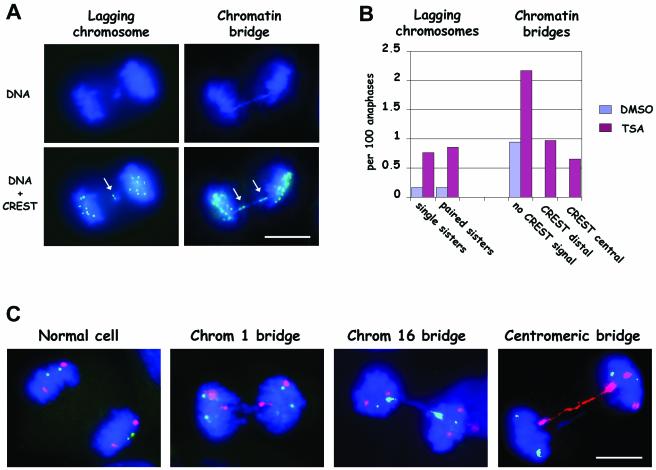
Posttranslational modifications of core histones contribute to driving changes in chromatin conformation and compaction. Herein, we investigated the role of histone deacetylation on the mitotic process by inhibiting histone deacetylases shortly before mitosis in human primary fibroblasts. Cells entering mitosis with hyperacetylated histones displayed altered chromatin conformation associated with decreased reactivity to the anti-Ser 10 phospho H3 antibody, increased recruitment of protein phosphatase 1-delta on mitotic chromosomes, and depletion of heterochromatin protein 1 from the centromeric heterochromatin. Inhibition of histone deacetylation before mitosis produced defective chromosome condensation and impaired mitotic progression in living cells, suggesting that improper chromosome condensation may induce mitotic checkpoint activation. In situ hybridization analysis on anaphase cells demonstrated the presence of chromatin bridges, which were caused by persisting cohesion along sister chromatid arms after centromere separation. Thus, the presence of hyperacetylated chromatin during mitosis impairs proper chromosome condensation during the pre-anaphase stages, resulting in poor sister chromatid resolution. Lagging chromosomes consisting of single or paired sisters were also induced by the presence of hyperacetylated histones, indicating that the less constrained centromeric organization associated with heterochromatin protein 1 depletion may promote the attachment of kinetochores to microtubules coming from both poles.


Figures

Figure 1.
Figure 1.
Short-term treatments with the deacetylase inhibitor TSA decrease mitotic index and induce histone hyperacetylation in mitotic cells. (A) Asynchronously growing human fibroblast MRC-5 cells were treated for 1 h (solid bars) or 7 h (squared bars) with different concentrations of TSA and the mitotic frequency was evaluated on Giemsa-stained slides. The graph reports the mean ± SE of the results obtained in three independent experiments. (B) Immunofluorescence detection of Lys 9 acetylated H3 histone on interphase and mitotic (arrows) MRC-5 cells fixed after 7 h in the presence of 1% DMSO (–TSA) or 500 ng/ml TSA (+TSA). Similar results were obtained after 1-h incubation with 500 ng/ml TSA. Bar, 5 μm. (C) Anti Lys 9 acetyl H3 immunoblotting of nuclear proteins from MRC-5 cells incubated for 1 h with 0.1% DMSO (control) or 500 ng/ml TSA (TSA) or receiving 35 ng/ml nocodazole for 18 h (NOC) or 35 ng/ml nocodazole for 18 h and 500 ng/ml TSA for the last 2 h (NOC + TSA).
Figure 2.
Figure 2.
Lys 9 H3 acetylation decreases reactivity to the anti-Ser 10 phospho H3 antibody on immunocytochemical preparations. (A) Immunofluorescence detection of Ser 10 phospho H3 histone in different mitotic phases in MRC-5 cells treated for 7 h with 500 ng/ml TSA (+TSA) or receiving 0.1% DMSO (–TSA). First row, an early prophase cell (arrow) in control culture showing phospho H3 staining. Second row, metaphase (arrow) and anaphase (arrowhead) cells in control culture showing intense phospho H3 reactivity. Third and fourth row, metaphase (arrow) and anaphase (arrow) cells in TSA-treated cultures, in which phospho H3 reactivity is diminished. Bar, 10 μm. (B) Higher magnification of MRC-5 metaphase cells immunostained for the phospho-Ser10 H3 histone. A control metaphase cell (–TSA) and a cell treated with 500 ng/ml TSA for 1 h (+TSA) are shown. Bar, 5 μm. Note that the antibody reactivity is confined to the periphery of the chromatid.
Figure 3.
Figure 3.
Lys 9 H3 acetylation decreases reactivity to the anti-Ser 10 phospho H3 antibody on mitotic cells without affecting MPM-2 staining. (A) Immunofluorescence detection of Ser 10 phospho H3 histone and MPM-2 epitopes on metaphase MRC-5 cells treated with 0.1% DMSO (–TSA) or receiving 500 ng/ml TSA for 7 h (+TSA). The TSA-treated cell shows clear MPM-2 staining and no phospho H3 reactivity. Bar, 5 μm. (B) Analysis of phospo H3 reactivity in MPM-2–positive cells. MRC-5 cells were incubated for 7 h with 0.1% DMSO (control) or 500 ng/ml TSA (TSA) or received 35 ng/ml nocodazole for 7 h (NOC), or 35 ng/ml nocodazole and 500 ng/ml TSA for 7 h (NOC + TSA). MPM-2–positive metaphases were classified as weakly positive (example in Figure 2B, +TSA) or negative (example in Figure 3A, +TSA) for phospho H3 staining by eye. About 100 mitoses were scored per experimental point.
Figure 4.
Figure 4.
PP1-δ is recruited on interphase and mitotic chromatin containing hyperacetylated histones. (A) Immunofluorescence detection of PP1-δ on interphase MRC-5 cells treated for 1 h with 0.1% DMSO (–TSA) or receiving 500 ng/ml TSA (+TSA). PP1-δ antibody stains heavily nuclei in TSA-treated cultures. Bar, 10 μm. (B) Immunofluorescence detection of PP1-δ on mitotic chromosomes in MRC-5 cells treated for 1 h with 0.1% DMSO (–TSA) or receiving 500 ng/ml TSA (+TSA). The metaphase chromosomes from a TSA-treated culture show an intense PP1-δ staining. Bar, 5 μm.
Figure 5.
Figure 5.
Lys 9 H3 acetylation does not interfere with Ser 10 H3 phosphorylation. Anti-Ser 10 phospho H3 immunoblotting of nuclear proteins in asynchronously growing MRC-5 cells (MRC-5) or synchronized HeLa cells (HeLa). MRC-5 cells were either incubated for 7 h with 0.1% DMSO (control) or 500 ng/ml TSA for 1 h (1h TSA) or 7 h (7 h TSA), or else received 35 ng/ml nocodazole for 7 h (NOC) or 35 ng/ml nocodazole and 500 ng/ml TSA for 7 h (NOC + TSA). Nuclear proteins were prepared, immunoblotted with the anti-Ser 10 phospho H3 antibody, and revealed by chemiluminescence. HeLa cells were synchronized in S phase by a thymidine/aphidicolin block. Nuclear proteins were prepared and immunoblotted with the anti-Ser 10 phospho H3 antibody at the end of the aphidicolin treatment (S phase), after 13-h release in complete medium (mitotic), or after 13-h release in complete medium, including a final 1 h (1 h TSA) or7h(7h TSA) treatment with 500 ng/ml TSA. In both MRC-5 and HeLa cells, intracellular levels of phospho H3 histone did not show significant variations after TSA.
Figure 6.
Figure 6.
Chromosome condensation is impaired in living cells when histones are maintained acetylated in mitosis. H2B-GFP–expressing PtK1 cells were treated for 5 h with 500 ng/ml TSA (+TSA) or 0.1% DMSO (–TSA) and then observed for H2B-GFP by fluorescence microscopy. Cells at different mitotic stages are shown: prophase (Pro-), prometaphase (prometa-), metaphase (meta-), and telophase (telo-). At all mitotic stages, chromosomes in TSA-treated cells were less compact and showed areas of low GFP fluorescence alternated with globular fluorescent spots. Bar, 5 μm.
Figure 7.
Figure 7.
Heterochromatin protein 1 accumulation at centromeres is impaired in cells briefly exposed to TSA. (A) Immunofluorescence detection of HP1α and kinetochore proteins by using 2HP 1H5 antibody and CREST serum on PtK1 metaphase cells from cultures treated for 7 h with 0.1% DMSO (–TSA) or 500 ng/ml TSA (+TSA). DNA was counterstained using DAPI (blue). The right column shows an overlay of CREST, HP1, and DAPI staining. HP1 is detected at centromeres in a region wider than the one defined by the CREST antibody in the control cell (top, middle panel). In the TSA-treated cell the centromeric accumulation is lost (bottom, middle panel). Bar, 5 μm. (B) Quantitative analysis of HP1 fluorescence on MRC-5 and PtK1 cells treated for 7 h with 0.1% DMSO (red bars) or receiving 500 ng/ml TSA for 1 h (white bars) or 7 h (gray bars). The values shown are the mean + SE of kinetochore fluorescence intensities (obtained as described in MATERIALS AND METHODS). Numbers above bars represent numbers of kinetochores measured per each experimental condition. p < 0.001 when TSA-treated samples were compared with their respective controls by the Student's t test.
Figure 8.
Figure 8.
Chromosome segregation defects in TSA-treated MRC-5 cells derive from defective sister chromatid separation. (A) Immunofluorescence detection of kinetochores and DNA staining on anaphase cells, showing lagging chromosomes or chromatin bridges. The lagging chromosome shows two paired CREST signals (arrow). The chromatin bridge shows two extended CREST signals at the ends of the bridge (arrows). Bar, 5 μm. (B) Quantitative analysis of the induction of chromosome segregation defects after TSA treatment. Lagging chromosomes were classified as showing one CREST signal (single sisters) or two paired CREST signals (paired sisters) both in DMSO- and TSA-treated cells. Chromatin bridges, both in TSA-treated cells and DMSO-treated cells, were classified as follows: without identifiable CREST signal (without CREST signal); with CREST signal at opposite ends of the bridge (CREST distal); with CREST signal along the chromatin bridge (CREST central). The graph shows results obtained scoring 937 anaphase cells in DMSO-treated cells and 921 anaphase cells in TSA-treated cultures. Data from 1-h and 7-h treatments with TSA were pooled because no appreciable differences were observed. (C) Fluorescence in situ hybridization with chromosome 16-specific alphoid probe (fluorescein isothiocyanate, green) and chromosome 1 classical satellite probe (rhodamine, red) on anaphase MRC-5 cells after treatment with TSA. DNA was counterstained with DAPI (blue). A regular distribution of the two chromosomes is expected to give two green signals and two red signals on each group of segregated chromosomes (normal cell). Some chromatin bridges on anaphase cells showed two extended red (chromatin 1 bridge) or green (chromosome 16 bridge) signals at the opposite ends of the connecting chromatin. In other cases, the centromeric signal totally overlapped the chromatin bridge (centromeric bridge). Anaphases (519) were scored in TSA-treated cells and 11 chromatin bridges involving either chromosome 1 or chromosome 16 were recorded. Two of 11 were centromeric bridges.

References

    1. Adams, R.R., Maiato, H., Earnshaw, W.C., and Carmera, M. (2001). Essential role of Drosophila inner centromere protein (INCENP) and aurora B in histone H3 phosphorylation, metaphase chromosome alignment, kinetochore disjunction and chromosome segregation. J. Cell Biol. 153, 865–879. - PMC - PubMed
    1. Andreassen, P.R., Lacroix, F.B., Villa-Moruzzi, E., and Margolis, R.L. (1998). Differential subcellular localization of protein phosphatase-1α, γ1 and δ isoforms during both interphase and mitosis in mammalian cells. J. Cell Biol. 141, 1207–1215. - PMC - PubMed
    1. Bannister, A.J., Zegerman, P., Partridge, J.F., Miska, E.A., Thomas, J.O., Allshire, R.C., and Kouzarides, T. (2001). Selective recognition of methylated lysine 9 on histone H3 by the HP1 chromo domain. Nature 410, 120–124. - PubMed
    1. Belayev, N.D., Keohane, A.M., Turner, B.M. (1996). Differential underacetylation of histones H2A, H3, and H4 on the inactive X chromosome in human female cells. Hum. Genet. 97, 573–578. - PubMed
    1. Bernard, P., and Allshire, R. (2002). Centromeres become unstuck without heterochromatin. Trends Cell Biol. 12, 419–424. - PubMed