Comparative Study
. 2003 Oct;23(19):6857-75.
doi: 10.1128/MCB.23.19.6857-6875.2003.

Puralpha is essential for postnatal brain development and developmentally coupled cellular proliferation as revealed by genetic inactivation in the mouse

Affiliations
Comparative Study

Puralpha is essential for postnatal brain development and developmentally coupled cellular proliferation as revealed by genetic inactivation in the mouse

Kamel Khalili et al. Mol Cell Biol. 2003 Oct.

Abstract

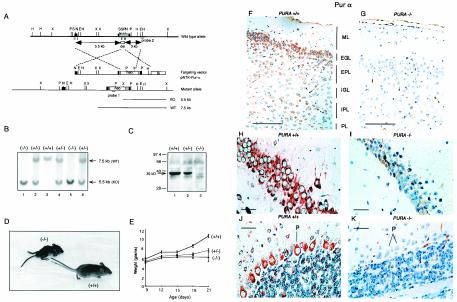
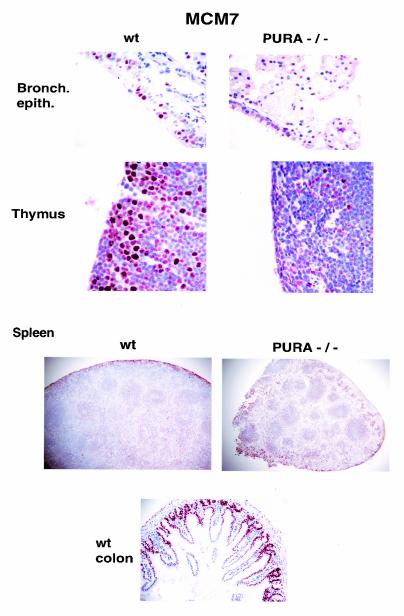
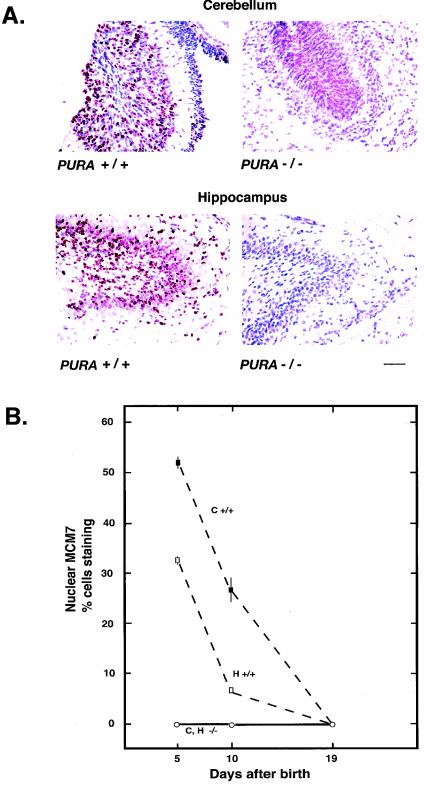
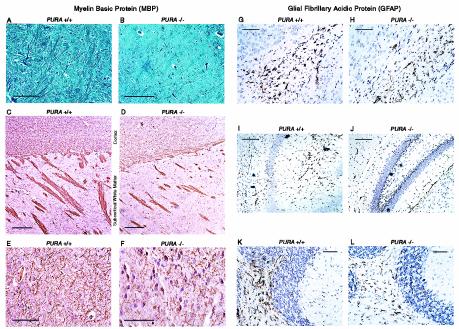
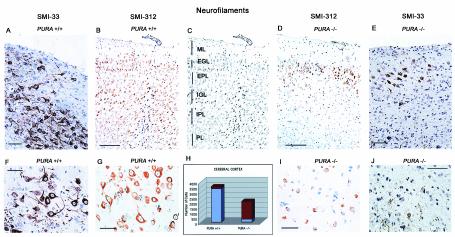
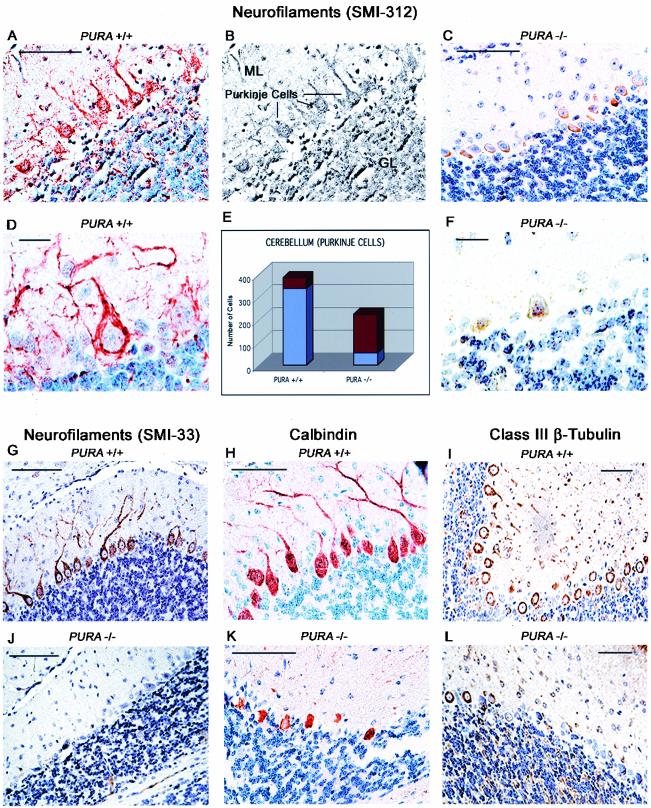
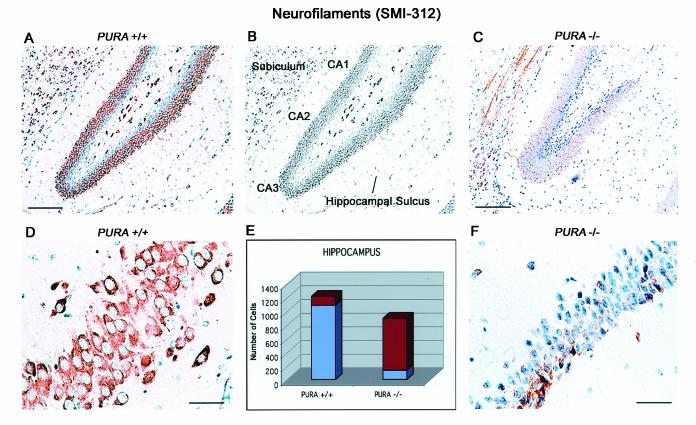
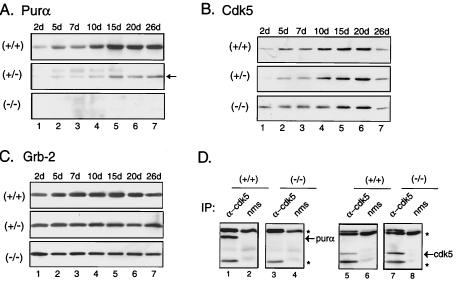
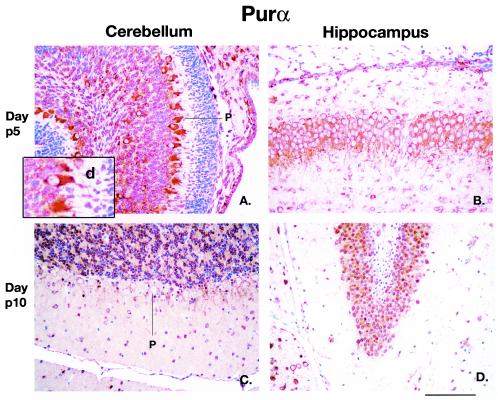
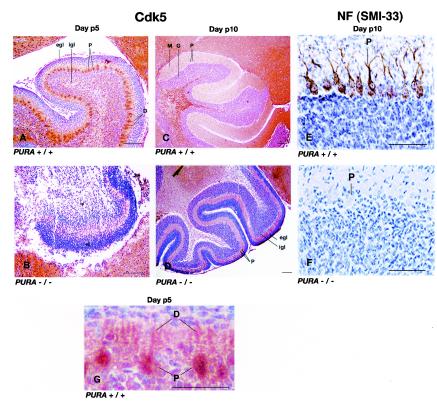
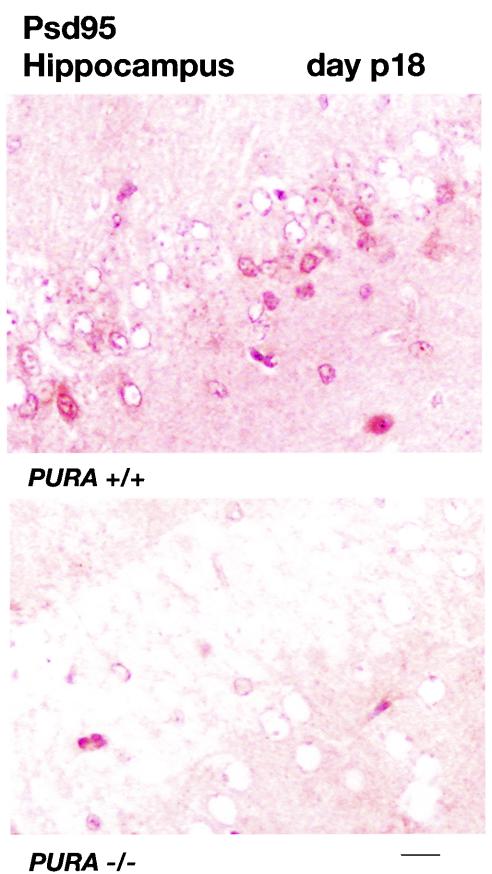
The single-stranded DNA- and RNA-binding protein, Puralpha, has been implicated in many biological processes, including control of transcription of multiple genes, initiation of DNA replication, and RNA transport and translation. Deletions of the PURA gene are frequent in acute myeloid leukemia. Mice with targeted disruption of the PURA gene in both alleles appear normal at birth, but at 2 weeks of age, they develop neurological problems manifest by severe tremor and spontaneous seizures and they die by 4 weeks. There are severely lower numbers of neurons in regions of the hippocampus and cerebellum of PURA(-/-) mice versus those of age-matched +/+ littermates, and lamination of these regions is aberrant at time of death. Immunohistochemical analysis of MCM7, a protein marker for DNA replication, reveals a lack of proliferation of precursor cells in these regions in the PURA(-/-) mice. Levels of proliferation were also absent or low in several other tissues of the PURA(-/-) mice, including those of myeloid lineage, whereas those of PURA(+/-) mice were intermediate. Evaluation of brain sections indicates a reduction in myelin and glial fibrillary acidic protein labeling in oligodendrocytes and astrocytes, respectively, indicating pathological development of these cells. At postnatal day 5, a critical time for cerebellar development, Puralpha and Cdk5 were both at peak levels in bodies and dendrites of Purkinje cells of PURA(+/+) mice, but both were absent in dendrites of PURA(-/-) mice. Puralpha and Cdk5 can be coimmunoprecipitated from brain lysates of PURA(+/+) mice. Immunohistochemical studies reveal a dramatic reduction in the level of both phosphorylated and nonphosphorylated neurofilaments in dendrites of the Purkinje cell layer and of synapse formation in the hippocampus. Overall results are consistent with a role for Puralpha in developmentally timed DNA replication in specific cell types and also point to a newly emerging role in compartmentalized RNA transport and translation in neuronal dendrites.


Figures

FIG. 1.
FIG. 1.
Creation of mice with targeted gene disruption of PURA, genotypic analysis, and absence of Purα protein in PURA−/− mice. (A) Strategy for inactivation of the PURA gene in ES cells. Sequences of the mouse PURA gene in ES cells were replaced with those encoding the eukaryotic selectable marker neomycin as described in Materials and Methods. The resulting alleles were 7.5 kb in size for the PURA+/+ mice and 5.5 kb for mice with the gene deletion. (B) Genomic DNA blotting demonstrates the genotype of mice which are homozygous (PURA−/−), heterozygous (PURA+/−), or wild-type (PURA+/+) for the PURA gene. (C) Immunoblot analysis of whole-cell mouse brain extract reveals a complete absence of the band representing Purα protein in the PURA−/− animal and reduced levels of Purα protein in PURA+/− animals in comparison to its level in wild-type, PURA+/+, littermates. Equal amounts of protein were loaded in each lane. (D) Homozygous PURA−/− mouse pictured next to a wild-type PURA+/+ littermate at 18 days of age. (E) Comparison of the total body weight of PURA mice between days 9 and 21 after birth. The growth of the PURA−/− mice is severely retarded while the PURA+/− mice show an intermediate phenotype. (F) Immunohistochemical analysis was performed on cortical brain sections from paraffin-embedded formalin-fixed tissue of day p19 PURA+/+ and PURA−/− mice with anti-Purα antibody. The +/+ mouse brains display abundant cytoplasmic immunoreactivity, particularly in the external granular layer (EGL). (G) Similar sections of brain tissue from PURA−/− mice exhibit no evidence of labeling; however, the cortical layers appear less cellular, the molecular layer (ML) appears broader, and the external granular layer is disorganized compared to those of the PURA+/+ mouse. EPL, external pyramidal layer; IGL, internal granular layer; IPL, internal pyramidal layer; PL, polymorphic layer. (H) The majority of hippocampal neurons in the horn of Ammon show cytoplasmic labeling for Purα in PURA+/+ mice. (I) A similar section within the hippocampus of PURA−/− mice shows an absence of immunoreactivity when labeled for Purα. (J) Cytoplasmic expression of Purα is seen in some cerebellar granular cells and all Purkinje cells (P) in PURA+/+ mice. (K) PURA−/− mice show an absence of labeling for Purα in the cerebellum. The granular and Purkinje cell layers are less populated than those of the PURA+/+ littermate. Panels F through K have a hematoxylin counterstain. Bars, 100 μm (F and G), 10 μm (H and I), and 20 μm (J and K). WT, wild type; KO, knockout.
FIG. 2.
FIG. 2.
Decrease in number of cells undergoing DNA replication in a variety of tissues from PURA−/− mice. Paraffin-embedded tissues from littermate PURA+/+ and PURA−/− mice, taken at day 19 after birth, were sectioned, treated with anti-MCM7 antibody, and visualized as described in Materials and Methods. MCM7 is visualized as red-brown. The control colon section at the bottom confirms that cells undergoing DNA replication, at the bases of crypts, possess nuclei positively labeling for MCM7 while cells not replicating DNA, at the tops of crypts, do not. Bars, 50 μm. A hematoxylin counterstain was used in all panels. wt, wild type.
FIG. 3.
FIG. 3.
Absence of cells undergoing DNA replication in the cerebellum and hippocampus of PURA−/− mice from 5 to 10 days after birth. Paraffin-embedded sections of brains from littermate PURA+/+ and PURA−/− mice, taken at day p10, were treated with antibody to MCM7, a marker for DNA replication, and visualized as described in Materials and Methods. (A) Sections from the most dorsal lobe of the cerebellum (top) and the horn of Ammon of the hippocampus (bottom). Bar, 50 μm. (B) Brains were obtained from littermate mice at 5, 10, and 19 days after birth. Microscopic fields from four sections from each time point labeled as described above, at ×200 magnification, were subjected to counting of total cell number and number of cells with nuclei labeling positive for MCM7. Presented are the averages and standard deviations (vertical bars) of the percentages of cells positively labeled for MCM7 in the cerebellum (C) and hippocampus (H) for each time point for either wild-type mice (+/+) or mice with genetically inactivated PURA (−/−).
FIG. 4.
FIG. 4.
Immunohistologic analysis of oligodendrocytes and astrocytes demonstrates a decrease in intensity of myelin and MBP immunolabeling as well as a reduction in GFAP expression in white matter tracts in the absence of Purα. Paraffin-embedded sections of brain cerebral cortex from day p19 PURA+/+ and PURA−/− mice were stained for myelin and immunolabeled for the oligodendrocyte-specific cellular marker MBP. Myelin staining patterns in the cerebral cortex and subcortical white matter of mice lacking Purα appeared less intense when compared with those of PURA+/+ littermates (A and B), and immunohistochemistry to detect MBP revealed similar patterns in the cortex and subcortical white matter tracts (C and D). Similar evaluation for the astrocytic marker GFAP revealed less-intense labeling of cellular processes of PURA−/− mice in the cortex (G and H), white matter adjacent to the hippocampus (I and J), and white matter adjacent to the granular layer of the cerebellum (K and L). Bars, 100 μm (A to F, K, and L) and 10 μm (G to J).
FIG. 5.
FIG. 5.
Reduction in number of neurons and in neurofilament-labeled neurons in the cortex of PURA−/− mice. Paraffin-embedded sections of cerebral cortex from day p19 PURA+/+ and PURA−/− littermates were immunolabeled with an antibody which recognizes total neurofilaments (SMI33) or a cocktail of antibodies specific for phosphorylated neurofilaments (SMI312). Intense immunopositivity of total (A and F) and phosphorylated (B and G) neurofilaments was observed in the PURA+/+ mice while reduced labeling of total (D and I) and phosphorylated (E and J) neurofilaments was seen in the PURA−/− mice. Panel C depicts the location of the six cortical layers, including the molecular layer (ML), external granular layer (EGL), external pyramidal layer (EPL), internal granular layer (IGL), internal pyramidal layer (IPL), and polymorphic layer (PL). As summarized in panel H, 20 microscopic fields from sections of two different mice labeled as described above, at ×200 magnification, were subjected to counting of total cell number and number of cells with positive cytoplasmic expression of phosphorylated neurofilaments using antibody SMI312. Presented are the average total number of neurons counted (red) and the fraction of those cells positively labeled for phosphorylated neurofilaments (blue). These cell counts expressed as percentages of neuronal loss and a calculated neurofilament labeling index are presented in Table 1. All panels contain a hematoxylin counterstain. Bars, 50 μm (A and E), 100 μm (B and D), and 20 μm (F, G, I, and J).
FIG. 6.
FIG. 6.
Reduction in number of neurons and neurofilament-labeled neurons in the cerebellum of PURA−/− mice. Wild-type mice display abundant immunolabeling of phosphorylated neurofilaments within the molecular, Purkinje, and granular layers (A and D), whereas in PURA−/− mice, this expression is severely reduced in all layers of the cerebellum (C and F). Panel B depicts the location of the molecular layer (ML), internal granular layer (IGL), and Purkinje cell layers of the cerebellum. As summarized in panel E, the total number of Purkinje cells and the number of Purkinje cells with positive labeling for phosphorylated neurofilaments were determined throughout a section containing all five foliae of thecerebellums (represented across approximately 50 microscopic fields) of two different mice labeled with antibody SMI312, at ×200 magnification. Presented are the average total number of neurons counted (red) and the fraction of those cells positively labeled for phosphorylated neurofilaments (blue). These cell counts expressed as percentages of neuronal loss and a calculated neurofilament labeling index are presented in Table 1. Immunolabeling with antibody recognizing total neurofilaments shows that Purkinje cell neurons are devoid of expression in the PURA−/− mice, whereas the Purkinje layer is intensely labeled in the PURA+/+ mice (G and J). The integrity of the Purkinje cells in the PURA−/− mice was examined by immunolabeling for the Purkinje cell marker calbindin or the neuronal cell marker class III β-tubulin. PURA−/− brain sections labeled with anticalbindin antibody demonstrate Purkinje cells with smaller and irregularly shaped cell bodies in reduced numbers compared with their PURA+/+ littermates (compare panels H and K). Immunohistochemistry for class III β-tubulin reveals robust cytoplasmic positivity of all Purkinje cells in sections of the PURA+/+ mouse brain while few Purkinje cells in the PURA−/− mice are positively labeled (I and L). All panels contain a hematoxylin counterstain. Bars, 100 μm (A, C, G, and H to L) and 10 μm (D and F).
FIG. 7.
FIG. 7.
Reduction in numbers of neurons and neurofilament-labeled neurons in the hippocampus of PURA−/− mice. Immunohistochemistry of sagittal sections with an antibody which recognizes phosphorylated forms of neurofilaments reveals intense cytoplasmic labeling in the majority of neurons within the horn of Ammon in PURA+/+ mice (A and D). Parallel immunolabeling of sections of PURA−/− mice revealed a reduction in the total number of neurons as well as a dramatic decrease in the number of neurons which are positive for neurofilaments (C and F). Panel B depicts the location of hippocampal landmarks, including the subiculum (S), hippocampal sulcus (HS), and the CA1, CA2, and CA3 regions. As summarized in panel E, the total number of hippocampal neurons and the number of hippocampal neurons showing cytoplasmic immunoreactivity with the phospho-specific neurofilament antibody SMI312 were counted throughout a section of the entire hippocampus (approximately 50 microscopic fields) from sections of two different mice labeled as above, at ×200 magnification. Presented are the average total number of neurons counted (red) and the fraction of those cells positively labeled for phospho-neurofilaments (blue). These cell counts expressed as percentages of neuronal loss and a calculated neurofilament labeling index are presented in Table 1. Bars, 100 μm (A and C) and 10 μm (D and F).
FIG. 8.
FIG. 8.
Purα and Cdk5 coimmunoprecipitation and immunoblot analysis for levels of Purα and Cdk5 proteins during development in PURA+/+, PURA+/−, and PURA−/− mice. Immunoblotting of whole-cell extracts from mouse brain at 2, 5, 7, 10, 15, 20, and 26 days (d) postnatal shows a gradual increase in Purα levels during development (A). Reduced levels following a similar pattern of increase are seen in extracts from PURA+/− mice while the Purα protein is undetectable at any time point in PURA−/− mice (A). Levels of Cdk5 protein in the same extracts show a gradual increase during development which peak at day 20 in PURA+/+ mice, whereas extracts from PURA+/− mice show reduced amounts of Cdk5 protein at 2, 5, and 7 days compared to PURA+/+ littermates (B). While Cdk5 protein levels in PURA−/− mice appear greater at 2 days of age and are slightly reduced compared with PURA+/+ mice at day 10, levels peak at day 20 as seen in the PURA+/+ mice (B). For each gel shown, equal amounts of lysate were loaded in each lane. Immunoblotting for an unrelated protein, Grb2, is shown as a control for equal loading (C). Immunoprecipitation (IP) performed on whole-cell extracts from 26-day-old mice using anti-Cdk5 antibody or nms followed by immunoblotting with anti-Purα antibody demonstrates the association of Cdk5 and Purα proteins in extracts prepared from PURA+/+ but not PURA−/− mouse brains (D, left). The same blots, stripped and reblotted with anti-Cdk5 (α-cdk5) antibody, show the detection of Cdk5 protein in extracts from PURA+/+ and PURA−/− mouse brains but not in nms (D, right).
FIG. 9.
FIG. 9.
Localization of Purα protein in cells of the cerebellum and hippocampus of wild-type PURA+/+ mice at postnatal days 5 and 10. Sections of paraffin-embedded brain tissue were treated with anti-Purα antibody and visualized as described in Materials and Methods. Sections taken at day p5 from the cerebellum and hippocampus are shown in panels A and B, respectively. The inset in panel A shows a higher magnification in which labeling with anti-Purα antibody in Purkinje cells can be visualized in the dendrites (d). Sections taken at day p10 from the cerebellum and hippocampus are shown in panels C and D, respectively. Cells in the cerebellar Purkinje cell layer, intensely labeling at day p5 but not at day p10, are labeled P. The darker brown labeling for Purα in panels C and D results from largely nuclear labeling. All panels are at the same magnification. Bar, 100 μm (D).
FIG. 10.
FIG. 10.
Defects in Cdk5 localization and neurofilament development in cerebellar Purkinje cells of mice with genetically inactivated PURA. Paraffin sections of mouse brains taken at the indicated postnatal times were treated with antibodies for either Cdk5 (A to D and G) or with SMI33, an antibody which recognizes total neurofilaments (E and F), and visualized as described in Materials and Methods. Sections from wild-type PURA+/+ mice taken at days p5 and p10 are shown in panels A and C, respectively. Labeled at day 5 are the external granular layer (egl), internal granular layer (igl), and Purkinje cell layer (P) as well as the Purkinje cell dendritic layer (D). Note the intense immunolabeling of the Purkinje cells with anti-Cdk5. At day p10 the external granular layer is not present, and the molecular (M) and granular layers have developed but the Purkinje cells at day p10 are devoid of Cdk5. Sections from PURA−/− mice at days p5 and p10 are shown in panels B and D, respectively. Note the lack of cerebellar organization and lack of intense immunolabeling of cells with anti-Cdk5 at days p5 and p10. Labeled are the external and internal granular layers, which are still observed in the day p10 PURA−/− mouse cerebellum. Sections labeled for total neurofilaments at day p10 from PURA+/+ and PURA−/− mice are shown in panels E and F, respectively. Cells corresponding to the Purkinje cell layer are labeled P. Purkinje cells (P) labeled with anti-Cdk5 are also shown at a higher magnification labeling in the PURA+/+ mouse at day p5, showing labeling extending to the dendrites (D). Bars, 100 μm.
FIG. 11.
FIG. 11.
Defective synapse formation in the hippocampus of the PURA−/− mouse. Brain sections from littermate PURA+/+ (upper panel) and PURA−/− (lower panel) mice at day p18 were treated with antibody specific for the postsynaptic density protein 95 (Psd95) and visualized as described in Materials and Methods. No counterstain was employed. Synapses on neuronal cell bodies can be visualized within the CA3 region as intensely labeling foci at the outer cell membranes. Bar, 10 μm.

Similar articles

Cited by

References

    1. Barr, S. M., and E. M. Johnson. 2001. Ras-induced colony formation and anchorage-independent growth inhibited by elevated expression of Puralpha in NIH3T3 cells. J. Cell. Biochem. 81:621-638. - PubMed
    1. Bergemann, A. D., and E. M. Johnson. 1992. The HeLa Pur factor binds single-stranded DNA at a specific element conserved in gene flanking regions and origins of DNA replication. Mol. Cell. Biol. 12:1257-1265. - PMC - PubMed
    1. Bergemann, A. D., Z. W. Ma, and E. M. Johnson. 1992. Sequence of cDNA comprising the human pur gene and sequence-specific single-stranded-DNA-binding properties of the encoded protein. Mol. Cell. Biol. 12:5673-5682. - PMC - PubMed
    1. Blow, J. J., and B. Hodgson. 2002. Replication licensing-origin licensing: defining the proliferative state? Trends Cell Biol. 12:72-78. - PMC - PubMed
    1. Chang, C.-F., G. Gallia, V. Muralidharan, N. N. Chen, P. Zoltick, E. Johnson, and K. Khalili. 1996. Evidence that replication of human neurotropic JC virus DNA in glial cells is regulated by the sequence-specific single-stranded DNA-binding protein Pur α. J. Virol. 70:4150-4156. - PMC - PubMed

Publication types

MeSH terms