. 2003 Oct;23(19):6936-43.
doi: 10.1128/MCB.23.19.6936-6943.2003.

Role of Plk2 (Snk) in mouse development and cell proliferation

Affiliations

Role of Plk2 (Snk) in mouse development and cell proliferation

Sheng Ma et al. Mol Cell Biol. 2003 Oct.

Abstract

Plk2 (Snk) is a polo-like kinase expressed at G(1) in cultured cells and mainly in the hippocampal neurons in the brains of adult rodents, but its function is poorly understood. We have generated mice deficient in Plk2 by gene targeting. Although Plk2 is not required for postnatal growth, Plk2(-/-) embryos show retarded growth and skeletal development late in gestation. The labyrinthine zone of the placenta is diminished in Plk2(-/-) embryos due to decreased cell proliferation. Cultured Plk2(-/-) embryonic fibroblasts grow more slowly than normal cells and show delayed entry into S phase. These data suggest a role for Plk2 in the cell cycle.


Figures

FIG. 1.
FIG. 1.
Gene targeting of the Plk2 locus. (A) Creation of a Plk2 deletion allele. Plk2 exons are indicated as solid boxes, with the asterisk indicating the first exon. The XbaI (Xb) fragment was cloned into a gene replacement vector, and the SalI fragment was replaced by a Neo cassette. The positions of PCR primers (p1 to p3) and exons whose corresponding cDNA sequences (5′ and 3′ probes) were used as the probes in Southern and Northern blot analyses are indicated. B, BamHI; S, SalI. (B) Southern blot analysis showing the disruption of the Plk2 locus. Genomic DNA was digested with BamHI and hybridized with radiolabeled 3′ Plk2 probe, followed by autoradiography. The wild-type locus yielded a fragment of ∼13 kbp, whereas the disrupted locus gave rise to a 6.8-kbp fragment, owing to a BamHI site introduced by the Neo cassette. +/+, +/−, and −/−, Plk2+/+, Plk2+/−, and Plk2−/−, respectively. (C) PCR analysis of the disrupted Plk2 locus. PCRs were carried out with primers p1 to p3 and mouse tail DNA. Reaction mixtures were resolved on an agarose gel and stained with ethidium bromide. (D) Northern blot analysis showing the disruption of Plk2 expression in Plk2−/− mice. On top is an autoradiograph showing detection with the 3′ Plk2 probe of the full-length and a truncated (arrowhead) Plk2 message in total RNA isolated from mouse brain. The controls were total RNA isolated from serum-starved NIH 3T3 cells (0h) or from cells stimulated with serum for 1 h (1h). The middle blot shows that the truncated Plk2 message does not hybridize to the 5′ Plk2 probe. The lower blot shows a methylene blue-stained membrane to demonstrate loading among the lanes. (E) Western blot analysis indicates the lack of Plk2 production in cultured embryonic fibroblasts. Cells were treated with nocodazole (M) and released into the cell cycle for 190 min (G1). On top is a Western blot with a polyclonal antibody specific for the C terminus of Plk2. The arrow indicates the position of Plk2, and molecular mass markers (in kilodaltons) are shown on the left. Below is a Western blot with anti-Erk1 antibody to demonstrate loading in each lane.
FIG. 2.
FIG. 2.
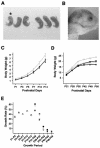
Postnatal growth of Plk2−/− mice. (A) Newborn Plk2−/− mouse (asterisk) is small and pale. (B) Enlarged picture showing the incompletely closed eyelids of a newborn Plk2−/− mouse. (C and D) Plk2−/− and wild-type mice have similar growth curves. Males and females were weighed separately starting from postnatal day 21 (P21) (D). The shaded lines represent wild-type mice, and the solid lines represent Plk2−/− mice. The open and solid squares represent males, and the circles represent females. The error bars indicate standard deviations. (E) Plk2−/− and wild-type mice show similar growth rates. The growth rate was calculated by expressing the weight gain as a percentage of the initial weight for each specified growth period. The shaded symbols represent wild-type animals, and the solid symbols represent Plk2−/− mice. Triangles, male and female; squares, male; circles, female.
FIG. 3.
FIG. 3.
Development of the skeleton in Plk2−/− embryos. Skeletal preparations from E14.5 to E18.5 embryos were stained with alcian blue and alizarin red. The ossification centers are stained red, and cartilage tissues are blue. Small embryos are enlarged to show details, so the sizes of the embryos on different embryonic days are not proportional. The labeled ossification centers are some of those that are indicative of the stage of skeletal development for the specified embryonic day (26). The insets at the right are ventral views of E18.5 skeletons showing delayed skeletal development in Plk2−/− embryos. tr, tympanic ring; pb, parietal bone; hb, cartilage primordium of body of hyoid bone; mb, metatarsal bones; meo, middle ear ossicles; pp, proximal phalanges; st, sternebrae; xp, upper region of xiphoid process.
FIG. 4.
FIG. 4.
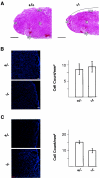
Analysis of the placentas of Plk2−/− embryos. (A) Hematoxylin- and eosin-stained section of half of a placenta showing diminished labyrinthine zone, indicated by white dashed lines, in Plk2−/− (−/−) embryos. The curved solid line depicts a portion of the maternal component that was peeled off during sample preparation. mc, maternal (decidual) component; sl, spongiotrophoblast layer at periphery of the placenta; lz, labyrinthine zone; cp, chorionic plate. +/+, Plk2+/+. Bar, 0.5 mm. (B) The labyrinthine zones of Plk2+/− (+/−) and Plk2−/− embryos contain similar numbers of apoptotic cells. On the left are fluorescence confocal microscopy images of TUNEL-stained (red) placenta sections. Cell nuclei were stained with DAPI (4′,6′-diamidino-2-phenylindole) (blue). On the right, counts of TUNEL-stained cells from five samples are summarized. The error bars indicate standard deviations. (C) Phospho-histone H3 staining shows that fewer cells are proliferating in the labyrinthine zone of the placenta of Plk2−/− embryos than in Plk2+/− embryos. On the left, fluoresence confocal microscopy images of sections of the labyrinthine zone are shown. Phospho-histone H3-positive cells are stained red, and cell nuclei are blue. On the right, counts of phospho-histone H3-positive cells from five tissue sections are summarized. The results are representative of two independent experiments.
FIG. 5.
FIG. 5.
Analysis of proliferation of cultured embryonic fibroblasts. (A) Cell proliferation assays. The cells were counted after 48 h of incubation. Values were calculated from one Plk2+/+, two Plk2+/−, and three Plk2−/− cell lines derived from a single litter. The results are representative of three independent experiments. The error bars indicate standard deviations. (B) FACS analysis of cell cycle progression after serum stimulation. Times after serum stimulation are shown on the left, and G1 (2N) and G2/M (4N) cell populations are indicated. The arrowheads point to differences between the S-phase cell populations in Plk2−/− and Plk2+/− cells. (C) Summary of FACS analyses of five Plk2−/− and three Plk2+/− cell lines from two independent experiments. A rapid increase in the S-phase cell population in Plk2+/− cells from 8 to 12 h after serum stimulation is indicated by an arrow.

Similar articles

Cited by

References

    1. Alexandru, G., F. Uhlmann, K. Mechtler, M. A. Poupart, and K. Nasmyth. 2001. Phosphorylation of the cohesin subunit Scc1 by Polo/Cdc5 kinase regulates sister chromatid separation in yeast. Cell 105:459-472. - PubMed
    1. Carmena, M., M. G. Riparbelli, G. Minestrini, A. M. Tavares, R. Adams, G. Callaini, and D. M. Glover. 1998. Drosophila polo kinase is required for cytokinesis. J. Cell Biol. 143:659-671. - PMC - PubMed
    1. Charron, J., B. A. Malynn, P. Fisher, V. Stewart, L. Jeannotte, S. P. Goff, E. J. Robertson, and F. W. Alt. 1992. Embryonic lethality in mice homozygous for a targeted disruption of the N-myc gene. Genes Dev. 6:2248-2257. - PubMed
    1. Chase, D., Y. Feng, B. Hanshew, J. A. Winkles, D. L. Longo, and D. K. Ferris. 1998. Expression and phosphorylation of fibroblast-growth-factor-inducible kinase (Fnk) during cell-cycle progression. Biochem. J. 333:655-660. - PMC - PubMed
    1. Conn, C. W., R. F. Hennigan, W. Dai, Y. Sanchez, and P. J. Stambrook. 2000. Incomplete cytokinesis and induction of apoptosis by overexpression of the mammalian polo-like kinase, Plk3. Cancer Res. 60:6826-6831. - PubMed

Publication types

MeSH terms