. 2003 Oct;23(19):6993-7004.
doi: 10.1128/MCB.23.19.6993-7004.2003.

Autoregulation of mouse histone deacetylase 1 expression

Affiliations

Autoregulation of mouse histone deacetylase 1 expression

Bernd Schuettengruber et al. Mol Cell Biol. 2003 Oct.

Abstract

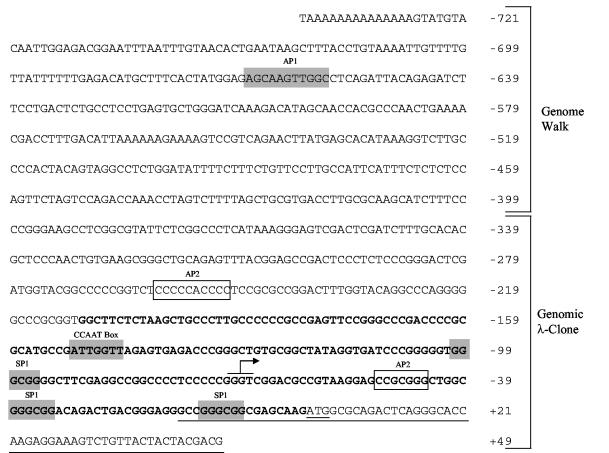
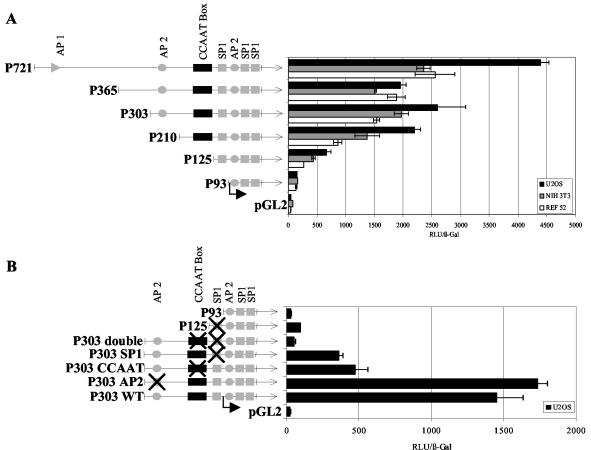
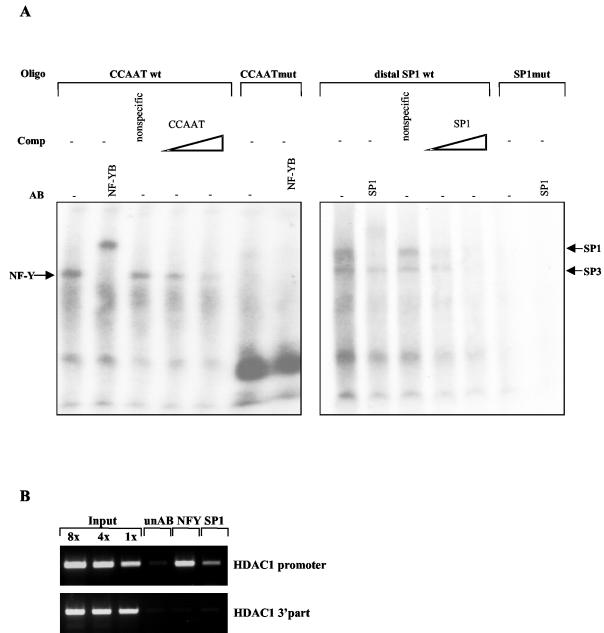
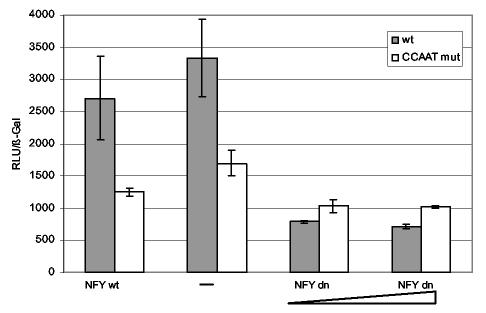
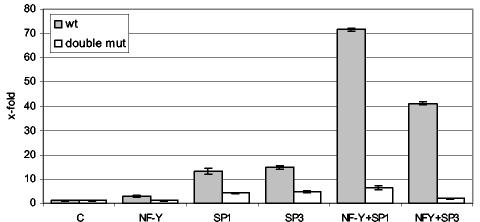
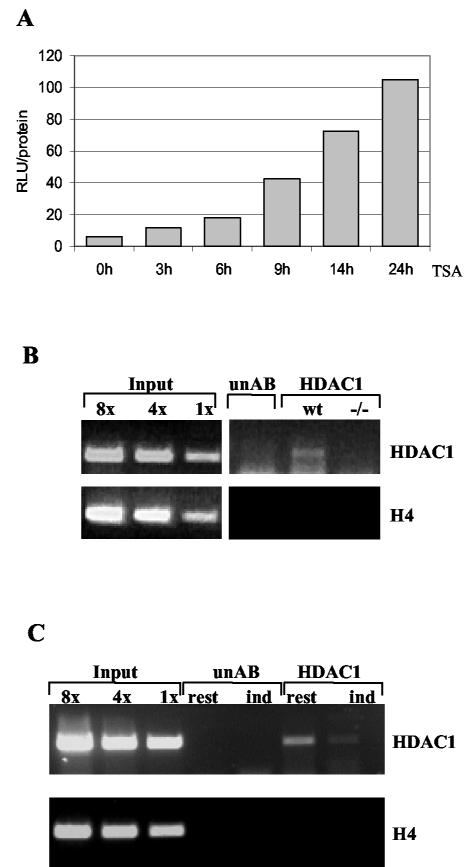
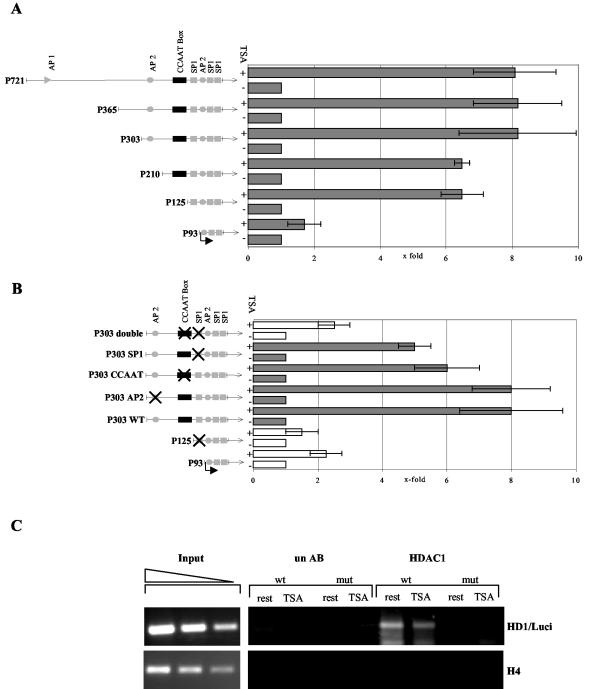
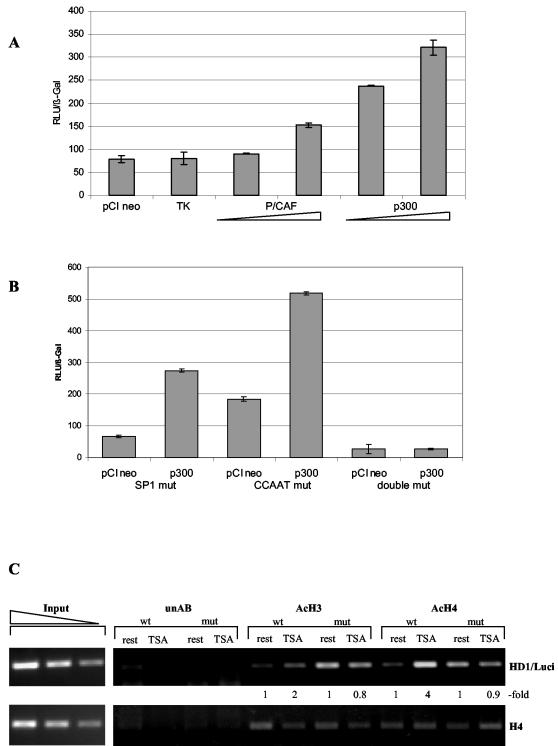
Histone deacetylase 1 (HDAC1) is a major regulator of chromatin structure and gene expression. Tight control of HDAC1 expression is essential for development and normal cell cycle progression. In this report, we analyzed the regulation of the mouse HDAC1 gene by deacetylases and acetyltransferases. The murine HDAC1 promoter lacks a TATA box consensus sequence but contains several putative SP1 binding sites and a CCAAT box, which is recognized by the transcription factor NF-Y. HDAC1 promoter-reporter studies revealed that the distal SP1 site and the CCAAT box are crucial for HDAC1 promoter activity and act synergistically to constitute HDAC1 promoter activity. Furthermore, these sites are essential for activation of the HDAC1 promoter by the deacetylase inhibitor trichostatin A (TSA). Chromatin immunoprecipitation assays showed that HDAC1 is recruited to the promoter by SP1 and NF-Y, thereby regulating its own expression. Coexpression of acetyltransferases elevates HDAC1 promoter activity when the SP1 site and the CCAAT box are intact. Increased histone acetylation at the HDAC1 promoter region in response to TSA treatment is dependent on binding sites for SP1 and NF-Y. Taken together, our results demonstrate for the first time the autoregulation of a histone-modifying enzyme in mammalian cells.


Figures

FIG. 1.
FIG. 1.
Mouse HDAC1 promoter. Putative transcription factor binding sites are boxed. The core promoter sequence (P210) is shown in boldface. The sequence overlapping with the murine HDAC1 cDNA (3) and the translational start codon are underlined. The arrow indicates the major transcripitonal start site.
FIG. 2.
FIG. 2.
Determination of the 5′ ends of mouse HDAC1 transcripts. Primer extension analysis with poly(A)+-selected RNA from a mouse liver was performed using the 32P-labeled SB8 oligonucleotide (lane 5). A genomic sequencing ladder (lane 6) was created in parallel and is shown with the appropriate radiolabeled nucleotides (lanes 1 to 4). The arrow indicates the major start site of transcription.
FIG. 3.
FIG. 3.
Luciferase activity driven by HDAC1 promoter 5′ deletions or point mutations. Schematic representations of wild-type and mutated promoter regions of the mouse HDAC1 gene used for the production of HDAC1-luciferase constructs are shown on the left. Site-specific disruption of individual elements is indicated by crossed boxes. Reporter constructs, together with a β-galactosidase reference vector, were transfected into cells, which were harvested after 48 h and assayed for luciferase activity. Enzyme activity was normalized to β-galactosidase activity. The means ± standard deviations of three independent experiments are shown. (A) Luciferase activities of HDAC1 wild-type promoter and deletions transiently transfected into U2OS cells, NIH 3T3 fibroblasts, and Ref52 cells. (B) Luciferase activities of HDAC1 P303 promoter and corresponding constructs with mutated transcription factor binding sites in U2OS cells.
FIG. 4.
FIG. 4.
Protein complexes interacting with binding sites in the HDAC1 promoter. (A) Electrophoretic mobility shift assays were performed by incubating protein extracts from exponentially growing Swiss 3T3 cells with the indicated oligonucleotide probes (Oligo). Antibodies (AB) and double-stranded competitor oligonucleotides (Comp; 10- and 100-fold molar excess) were added as indicated (−, not added). Specific complexes are marked by arrows. (B) NF-Y and SP1 are associated with the proximal HDAC1 promoter. Formaldehyde-cross-linked chromatin was prepared from proliferating Swiss 3T3 cells and precipitated with NF-YB antibodies (NFY), SP1 antibodies (SP1), or nonspecific antibodies (unAB). DNA from the antibody-bound fraction and total input DNA isolated from chromatin used for the immunoprecipitation were analyzed by quantitative PCR using primers specific for the HDAC1 promoter or the 3′ part of the mouse HDAC1 gene (exon 12).
FIG. 5.
FIG. 5.
HDAC1 promoter activity is repressed by a dominant-negative mutant of NF-YA. U2OS cells were transiently transfected with 0.5 μg of HDAC1 pP721 wild-type reporter plasmid (wt) or the corresponding CCAAT mutant reporter plasmid (CCAAT mut) without (−) or together with 0.5 or 1 μg of expression vector encoding dominant-negative NF-YA (NFY dn) and a β-galactosidase reference vector. As a control, the reporter plasmids were cotransfected with 1 μg of the expression plasmid pNF-YA13 encoding wild-type NF-YA (NFY wt). pCIneo empty vector was used to bring the total amount of the DNA mixture to 2 μg. The activity (in relative light units [RLU]) of luciferase relative to that of β-galactosidase is presented. The means ± standard deviations of three independent experiments are shown.
FIG. 6.
FIG. 6.
Synergistic activation of the HDAC1 promoter by Sp1/Sp3 and NF-Y in Drosophila SL-2 cells. Drosophila SL-2 cells were cotransfected with 0.5 μg of wild-type (wt) or double-mutated (double mut) HDAC1 reporter plasmids (pP721 or pP721double) with or without expression vectors encoding Sp1/Sp3 or NF-Y (100 ng each). The total amount of DNA (10 μg) was adjusted by the addition of salmon sperm DNA. The data are presented as stimulation (x-fold), where the value of luciferase activity normalized to total cell protein for the reporter alone is set at 1. The means ± standard deviations of three independent experiments are shown.
FIG. 7.
FIG. 7.
Autoregulation of the HDAC1 promoter. (A) Activation of stably integrated HDAC1 promoter P721 by TSA. Stably transfected Swiss 3T3 cells were serum arrested for 48 h and treated with TSA for the indicated periods. The cells were harvested, and luciferase activity (in relative light units [RLU]) was determined and normalized to the corresponding amount of protein. (B) HDAC1 is associated with its own promoter region. Formaldehyde-cross-linked chromatin was prepared from undifferentiated proliferating wild-type (wt) and HDAC1−/− (−/−) ES cells and immunoprecipitated with an HDAC1 antibody (HDAC1) or a nonspecific antibody (unAB). DNA from the antibody-bound fraction and total input DNA isolated from chromatin used for the immunoprecipitation were analyzed by quantitative PCR for the presence of the HDAC1 promoter region and the histone H4 control gene. (C) Specific recruitment of HDAC1 to the HDAC1 promoter region in resting Swiss 3T3 fibroblasts. Cross-linked chromatin was prepared from resting fibroblasts before (rest) and after (ind) restimulation with 20% FCS for 18 h and precipitated with the monoclonal HDAC1 antibody or an unrelated control antibody (unAB). The precipitated DNA was analyzed as described for panel B.
FIG. 8.
FIG. 8.
The distal SP1 binding site and the CCAAT box are crucial for TSA-mediated activation and recruitment of HDAC1 to its promoter region. (A) Schematic representations of wild-type and mutated promoter regions of the mouse HDAC1 gene are on the left. Site-specific disruption of individual elements is indicated by crossed boxes. Stably transfected Swiss 3T3 cells containing the HDAC1 5′ deletion mutants were serum arrested for 48 h and treated with TSA. After a further 20 h, the cells were harvested and assayed for luciferase activity. Enzyme activity was normalized to the corresponding protein concentration and plotted relative to the untreated value set as 1. The means ± standard deviations of three independent experiments are shown. (B) Stably transfected Swiss 3T3 cells containing the HDAC1 point mutants were treated as described for panel A and examined for luciferase activity. (C) Chromatin immunoprecipitation analysis of stably transfected HDAC1 promoter P721 for the presence of HDAC1. Cross-linked chromatin of resting (rest) or TSA-treated (TSA) stable cell lines carrying the wild-type HDAC1 promoter (wt) or the double-mutated HDAC1 promoter (mut) was immunoprecipitated with an HDAC1 antibody (HDAC1) or a nonspecific antibody (un AB). DNA from the antibody-bound fraction and total input DNA isolated from chromatin used for the immunoprecipitation were analyzed by quantitative PCR using a primer specific for the transfected promoter (HD1/Luci).
FIG.9.
FIG.9.
Involvement of histone acetyltransferases in the activation of the HDAC1 gene. (A) U2OS cells were transiently cotransfected with 0.5 μg of HDAC1 wild-type reporter plasmid (pP721) or with 0.5 or 1 μg of expression vectors encoding p300 or P/CAF, together with a β-galactosidase reference vector. As a control, the reporter plasmid was cotransfected with 1 μg of expression plasmids encoding the TK protein. pCIneo empty vector was used to bring the total amount of the DNA mixture to 2 μg. The activity of luciferase (in relative light units [RLU]) to relative to that of β-galactosidase is presented. The means ± standard deviations of three independent experiments are shown. (B) Cotransfection was carried out as described for panel A using HDAC1 point mutants (mut) as reporter constructs. (C) Chromatin immunoprecipitation performed with antibodies against acetylated histone H3 and H4 using chromatin isolated from stably transfected Swiss 3T3 cells carrying either the wild-type HDAC1 promoter (wt) or the double-mutated HDAC1 promoter (mut) before (rest) and after (TSA) TSA treatment. DNA from the antibody-bound fraction and total input DNA isolated from chromatin used for the immunoprecipitation were analyzed by quantitative PCR using a primer specific for the transfected promoter (HD1/Luci; see Materials and Methods). PCR products were quantified using the ImageQuant program, and relative signal intensities (-fold) are indicated.

Similar articles

Cited by

References

    1. Ahringer, J. 2000. NuRD and SIN3 histone deacetylase complexes in development. Trends Genet. 16:351-356. - PubMed
    1. Baker, A., M. Saltik, H. Lehrmann, I. Killisch, V. Mautner, G. Lamm, G. Christofori, and M. Cotten. 1997. Polyethylenimine (PEI) is a simple, inexpensive and effective reagent for condensing and linking plasmid DNA to adenovirus for gene delivery. Gene Ther. 4:773-782. - PubMed
    1. Bartl, S., J. Taplick, G. Lagger, H. Khier, K. Kuchler, and C. Seiser. 1997. Identification of mouse histone deacetylase 1 as a growth factor-inducible gene. Mol. Cell. Biol. 17:5033-5043. - PMC - PubMed
    1. Billon, N., D. Carlisi, M. B. Datto, L. A. van Grunsven, A. Watt, X. F. Wang, and B. B. Rudkin. 1999. Cooperation of Sp1 and p300 in the induction of the CDK inhibitor p21WAF1/CIP1 during NGF-mediated neuronal differentiation. Oncogene 18:2872-2882. - PubMed
    1. Braun, H., R. Koop, A. Ertmer, S. Nacht, and G. Suske. 2001. Transcription factor Sp3 is regulated by acetylation. Nucleic Acids Res. 29:4994-5000. - PMC - PubMed

Publication types

MeSH terms

LinkOut - more resources