

Receptive field structure of burst and tonic firing in feline lateral geniculate nucleus
- PMID: 12972624
- PMCID: PMC2343574
- DOI: 10.1113/jphysiol.2003.048561
Receptive field structure of burst and tonic firing in feline lateral geniculate nucleus
Abstract
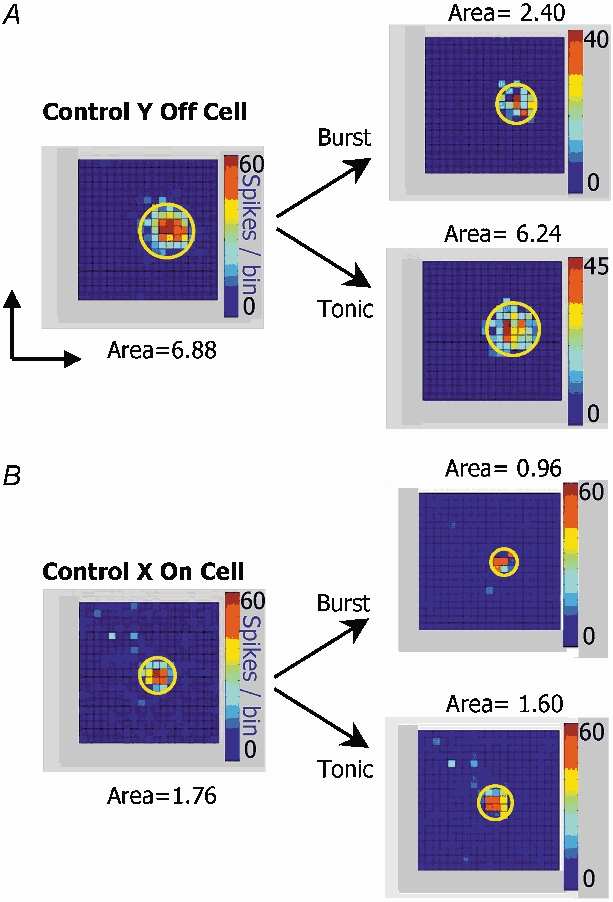
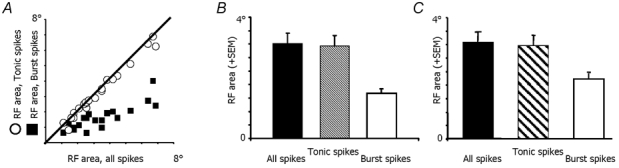
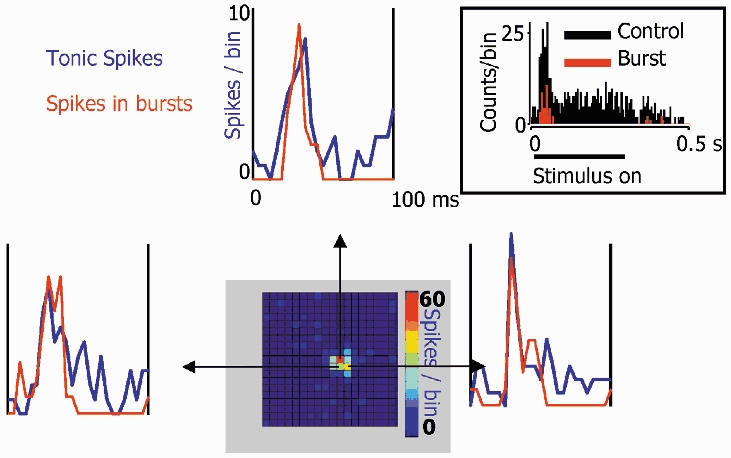
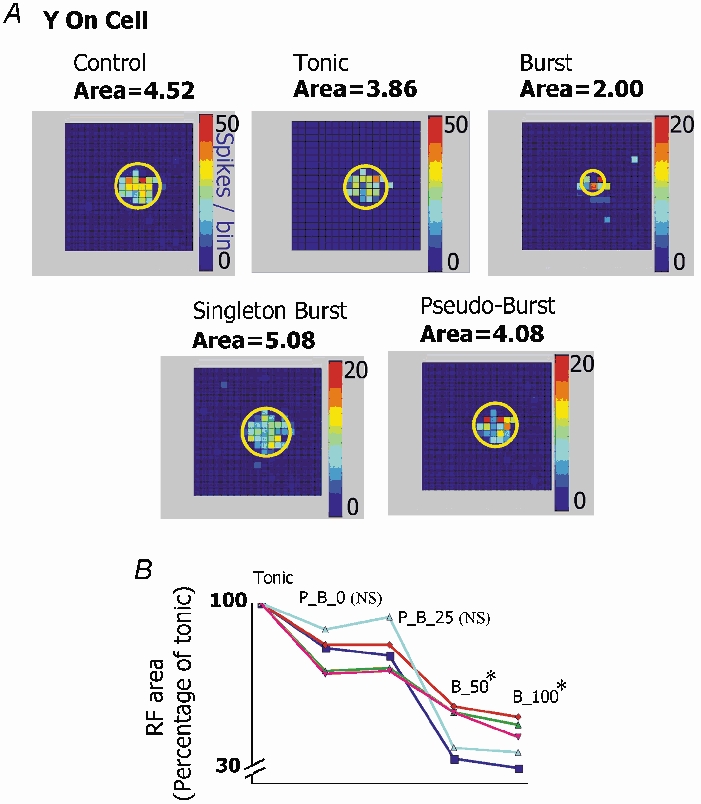
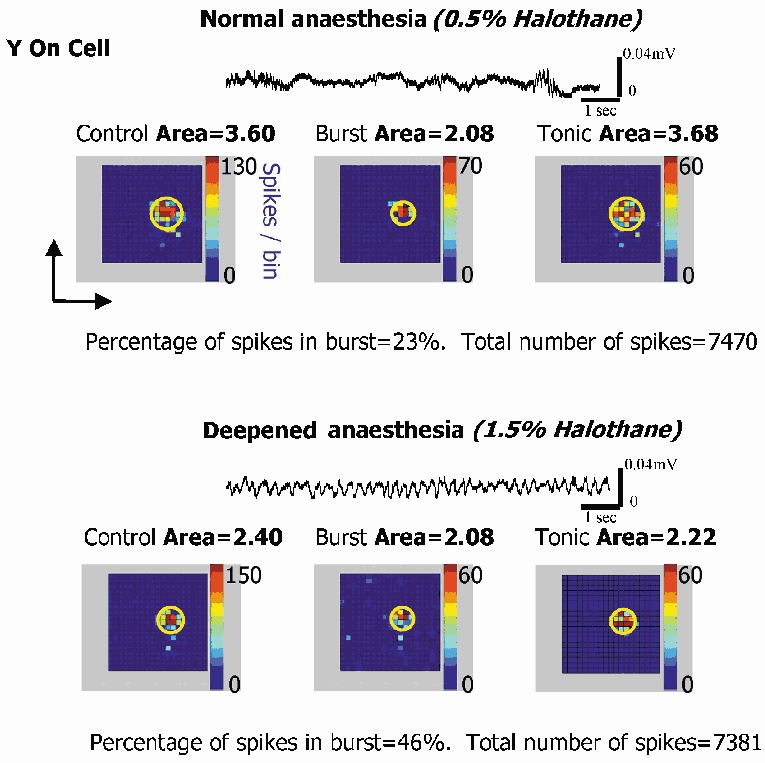
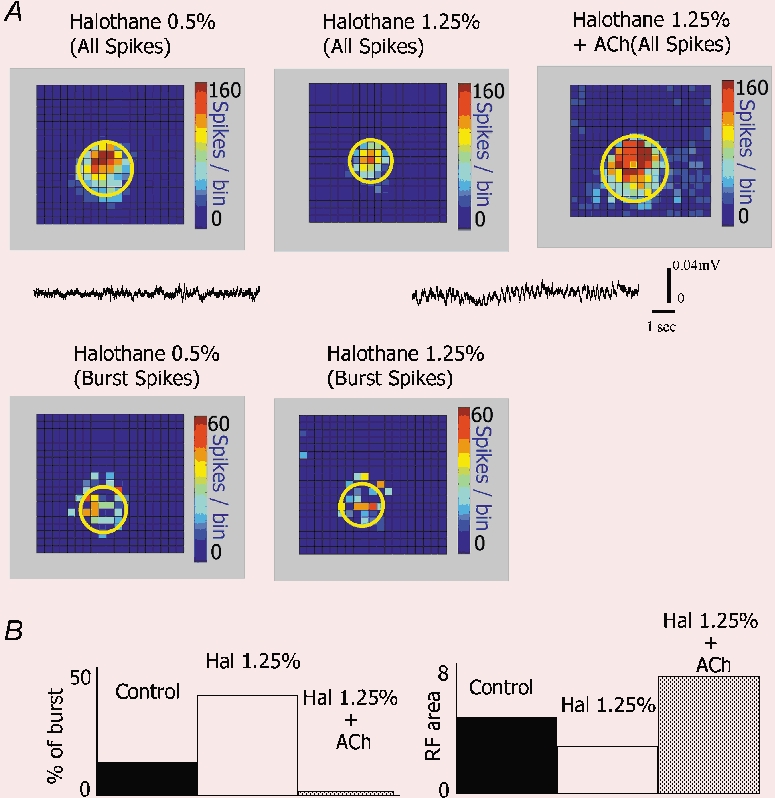
There are two recognised modes of firing activity in thalamic cells, burst and tonic. A low-threshold (LT) burst (referred to from now on as 'burst') comprises a small number of high-frequency action potentials riding the peak of a LT Ca(2+) spike which is preceded by a silent hyperpolarised state > 50 ms. This is traditionally viewed as a sleep-like phenomenon, with a shift to tonic mode at wake-up. However, bursts have also been seen in the wake state and may be a significant feature for full activation of recipient cortical cells. Here we show that for visual stimulation of anaesthetised cats, burst firing is restricted to a reduced area within the receptive field centre of lateral geniculate nucleus cells. Consistently, the receptive field size of all the recorded neurons decreased in size proportionally to the percentage of spikes in bursts versus tonic spikes, an effect that is further demonstrated with pharmacological manipulation. The role of this shrinkage may be distinct from that also seen in sleep-like states and we suggest that this is a mechanism that trades spatial resolution for security of information transfer.
Figures
Similar articles
-
Effects of membrane voltage on receptive field properties of lateral geniculate neurons in the cat: contributions of the low-threshold Ca2+ conductance.J Neurophysiol. 1992 Dec;68(6):2185-98. doi: 10.1152/jn.1992.68.6.2185. J Neurophysiol. 1992. PMID: 1337104
-
Relative contributions of burst and tonic responses to the receptive field properties of lateral geniculate neurons in the cat.J Neurophysiol. 1992 Dec;68(6):2199-211. doi: 10.1152/jn.1992.68.6.2199. J Neurophysiol. 1992. PMID: 1491266
-
Receiver operating characteristic (ROC) analysis of neurons in the cat's lateral geniculate nucleus during tonic and burst response mode.Vis Neurosci. 1995 Jul-Aug;12(4):723-41. doi: 10.1017/s0952523800008993. Vis Neurosci. 1995. PMID: 8527372
-
Dynamic properties of thalamic neurons for vision.Prog Brain Res. 2005;149:83-90. doi: 10.1016/S0079-6123(05)49007-X. Prog Brain Res. 2005. PMID: 16226578 Review.
-
Dual response modes in lateral geniculate neurons: mechanisms and functions.Vis Neurosci. 1996 Mar-Apr;13(2):205-13. doi: 10.1017/s0952523800007446. Vis Neurosci. 1996. PMID: 8737271 Review.
Cited by
-
Visual control of burst priming in the anesthetized lateral geniculate nucleus.J Neurosci. 2005 Apr 6;25(14):3531-8. doi: 10.1523/JNEUROSCI.4417-04.2005. J Neurosci. 2005. PMID: 15814783 Free PMC article.
-
The role of thalamic group II mGlu receptors in health and disease.Neuronal Signal. 2022 Nov 15;6(4):NS20210058. doi: 10.1042/NS20210058. eCollection 2022 Dec. Neuronal Signal. 2022. PMID: 36561092 Free PMC article. Review.
-
Bursting by taste-responsive cells in the rodent brain stem.J Neurophysiol. 2015 Apr 1;113(7):2434-46. doi: 10.1152/jn.00862.2014. Epub 2015 Jan 21. J Neurophysiol. 2015. PMID: 25609109 Free PMC article.
-
Physiological characterization of a rare subpopulation of doublet-spiking neurons in the ferret lateral geniculate nucleus.J Neurophysiol. 2020 Aug 1;124(2):432-442. doi: 10.1152/jn.00191.2020. Epub 2020 Jul 15. J Neurophysiol. 2020. PMID: 32667229 Free PMC article.
-
Bursting thalamic responses in awake monkey contribute to visual detection and are modulated by corticofugal feedback.Front Behav Neurosci. 2014 May 30;8:198. doi: 10.3389/fnbeh.2014.00198. eCollection 2014. Front Behav Neurosci. 2014. PMID: 24910601 Free PMC article.
References
-
- Edeline JM, Manunta Y, Hennevin E. Auditory thalamus neurons during sleep: changes in frequency selectivity, threshold, and receptive field size. J Neurophysiol. 2000;84:934–952. - PubMed
-
- Francesconi W, Muller CM, Singer W. Cholinergic mechanisms in the reticular control of transmission in the cat lateral geniculate nucleus. J Neurophysiol. 1988;59:1690–1718. - PubMed
-
- Friedberg MH, Lee SM, Ebner FF. Modulation of receptive field properties of thalamic somatosensory neurons by the depth of anesthesia. J Neurophysiol. 1999;81:2243–2252. - PubMed
Publication types
MeSH terms
Substances
LinkOut - more resources
Full Text Sources
Miscellaneous