. 2003 Oct;15(10):2273-84.
doi: 10.1105/tpc.013862. Epub 2003 Sep 5.

The STT3a subunit isoform of the Arabidopsis oligosaccharyltransferase controls adaptive responses to salt/osmotic stress

Affiliations

The STT3a subunit isoform of the Arabidopsis oligosaccharyltransferase controls adaptive responses to salt/osmotic stress

Hisashi Koiwa et al. Plant Cell. 2003 Oct.

Abstract

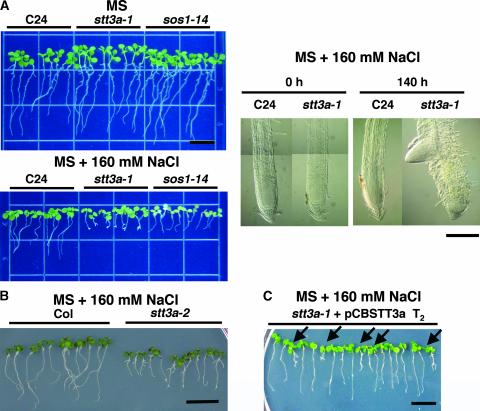
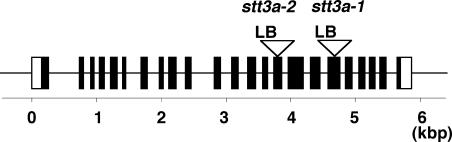
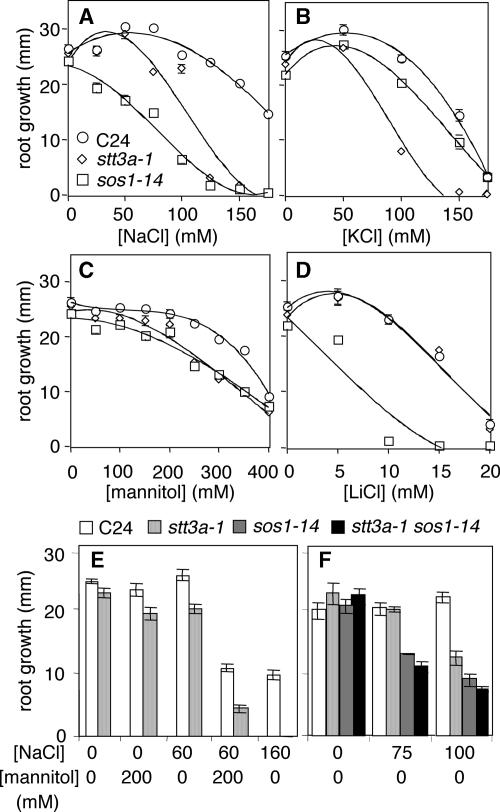
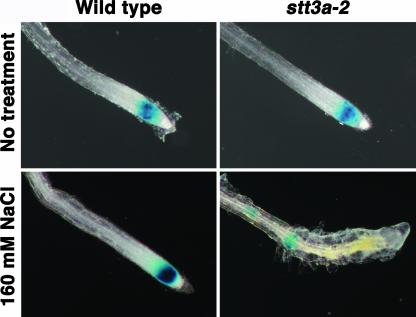
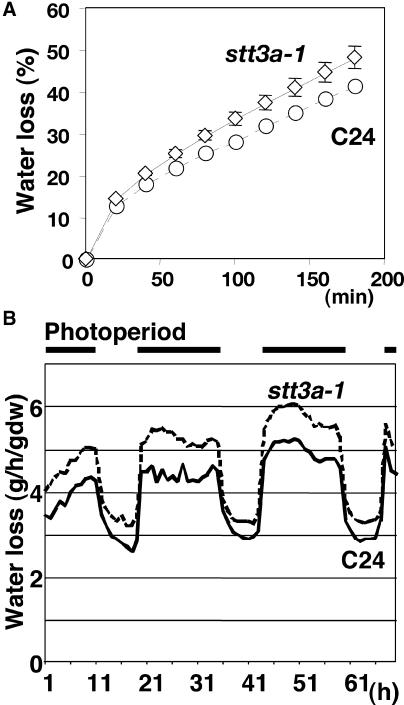
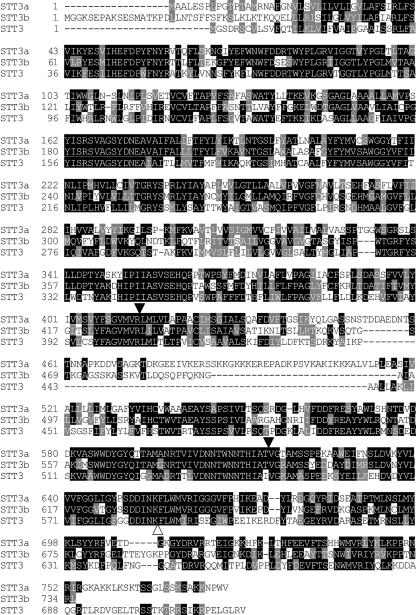
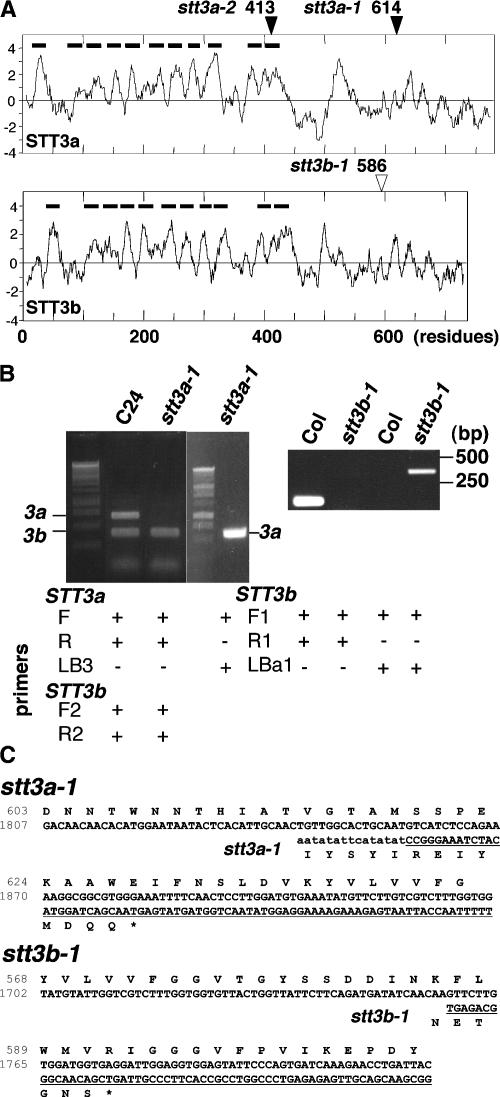
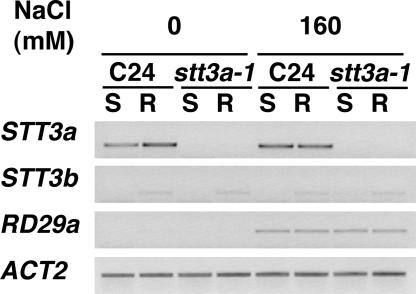
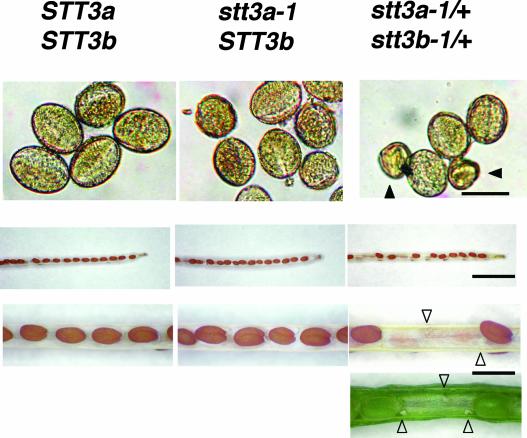
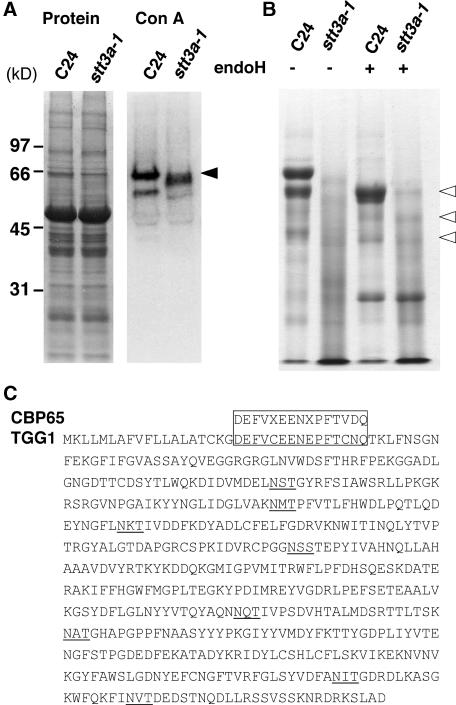
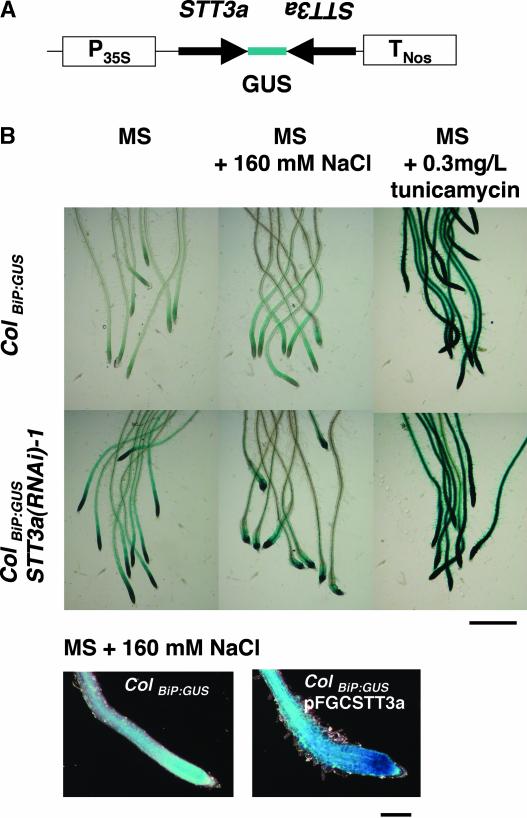
Arabidopsis stt3a-1 and stt3a-2 mutations cause NaCl/osmotic sensitivity that is characterized by reduced cell division in the root meristem. Sequence comparison of the STT3a gene identified a yeast ortholog, STT3, which encodes an essential subunit of the oligosaccharyltransferase complex that is involved in protein N-glycosylation. NaCl induces the unfolded protein response in the endoplasmic reticulum (ER) and cell cycle arrest in root tip cells of stt3a seedlings, as determined by expression profiling of ER stress-responsive chaperone (BiP-GUS) and cell division (CycB1;1-GUS) genes, respectively. Together, these results indicate that plant salt stress adaptation involves ER stress signal regulation of cell cycle progression. Interestingly, a mutation (stt3b-1) in another Arabidopsis STT3 isogene (STT3b) does not cause NaCl sensitivity. However, the stt3a-1 stt3b-1 double mutation is gametophytic lethal. Apparently, STT3a and STT3b have overlapping and essential functions in plant growth and developmental processes, but the pivotal and specific protein glycosylation that is a necessary for recovery from the unfolded protein response and for cell cycle progression during salt/osmotic stress recovery is associated uniquely with the function of the STT3a isoform.


Figures

Figure 1.
Figure 1.
Salt-Hypersensitive stt3a Mutants Identified by Forward Genetic and Computerized Screening. (A) At left, photographs of seedlings that were grown on MS agar medium for 1 week and then transferred to MS agar medium without (top) or with (bottom) 160 mM NaCl and incubated for 8 additional days: wild type (C24), stt3a-1, or C24 sos1 allele (sos1-14) seedlings. At right, root tip morphology of stt3a-1 before (0 h) and after (140 h) seedlings were exposed to NaCl. Seedlings were treated with NaCl, cleared with chloral hydrate, and observed with a microscope equipped with Nomarski differential interference contrast optics. Bars = 0.2 mm. (B) Seedlings of the stt3a-2 mutant, identified by computerized screening, also are NaCl hypersensitive. Bar = 10 mm. (C) An STT3a genomic fragment complements the salt-sensitive phenotype of stt3a-1 seedlings. T2 seedling progeny of stt3a-1 plants were transformed with pCBSTT3a, which contains a 9.3-kb genomic fragment containing the STT3a locus. Seedlings were transferred to medium containing 160 mM NaCl. Arrows indicate seedlings with a mutant phenotype (azygotes). Bar = 10 mm.
Figure 2.
Figure 2.
stt3a-1 and stt3a-2 Alleles Contain T-DNA Insertions in Different STT3a Exons. Scheme illustrates the location of the T-DNA insertions in STT3a (At5g19690) of the independent alleles. Exons (closed boxes) were deduced from the cDNA sequence, and open boxes indicate the 5′ and 3′ untranslated regions. Open triangles indicate T-DNA insertion sites, and the orientation of the T-DNA left border (LB) is indicated. stt3a-1 and stt3a-2 alleles contain T-DNA insertions in the 18th and 15th exons, respectively.
Figure 3.
Figure 3.
Root Growth of stt3a-1 Seedlings after Salt and/or Osmotic Stress Treatment. stt3a seedling root growth compared with that of the wild type (C24), sos1-14, or sos1-14 stt3a-1 according to the procedure described for Figure 1. One-week-old seedlings were transferred to medium with or without various amounts of NaCl (A), KCl (B), mannitol (C), LiCl (D), or NaCl and/or mannitol ([E] and [F]). Root growth (i.e., increase in length after transfer) was determined after 8 days. Error bars indicate standard errors.
Figure 4.
Figure 4.
CycB1;1 Expression in stt3a-2 Seedling Roots Is Disturbed by NaCl Treatment. NaCl sensitivity of F3 seedlings from a FA4 (CycB1;1-GUS) × stt3a-2 cross was tested as described for Figure 1 (i.e., stt3a-2 homozygotes are salt sensitive). GUS activity in the root tip was detected 4 days after transfer to medium with or without 160 mM NaCl.
Figure 5.
Figure 5.
stt3a-1 Plants Have Greater Transpirational Water Loss Than Wild-Type Plants (C24). (A) Shoots were detached from greenhouse-grown 1-month-old Arabidopsis plants and dehydrated on filter paper at 25°C and ∼50% humidity. The fresh weight of each shoot was measured at the time indicated (after detachment). Data shown are averages from 10 shoots of C24 wild-type plants or 11 shoots of stt3a-1 plants. Error bars indicate standard errors of the mean; note that the small error bars for C24 are invisible on the graph. (B) Transpirational water loss during a diurnal photoperiod (intensity of 140 μmol·m−2·s−1) at 25°C. Bars at top indicate the light period. The soil surface of pots in which plants were growing was sealed with plastic film to reduce evaporation. Plant water loss was measured by the gravimetric method using continuous monitoring of plant weight over a 70-h period. Each data point represents average results from nine plants. dw, dry weight.
Figure 6.
Figure 6.
Arabidopsis STT3a and STT3b Are Homologous with S. cerevisiae STT3. The predicted peptides of STT3a (At5g19690), STT3b (At1g34130), and STT3 from S. cerevisiae (NP_011493) were aligned using the CLUSTAL V analysis method. Identical residues in STT3 peptides are shaded in black, and residues with amino acid similarity are shaded in light gray. Closed and open arrowheads indicate the positions for truncation caused by the stt3a and stt3b mutations, respectively.
Figure 7.
Figure 7.
stt3a-1 and stt3b-1 Produce Chimeric Transcripts. (A) Kyte-Doolittle hydropathy profiling of STT3a (top) and STT3b (bottom). Bars indicate putative signal peptides and transmembrane regions, and arrowheads indicate the positions of mutations caused by T-DNA insertion. Note that the hydrophobic peaks at ∼500 are not conserved in yeast STT3. (B) RT-PCR analysis of STT3a and STT3b transcripts in stt3a-1 (left gel) and stt3b-1 (right gel) seedlings. Five micrograms of total RNA extracted from C24, stt3a-1, Col, or stt3b-1 seedlings were used for reverse transcription. One-twentieth of the first-strand cDNA was used as a template to perform PCR. Primers STT3aF1 (F), STT3aR1 (R), and LB3 were used to analyze stt3a-1 seedling RNA, and STT3bF1 (F1), STT3bR1 (R1), and LBa1 were used to analyze stt3b-1 seedling RNA. STT3b primers STT3bF2 (F2) and STT3bR (R2) were used as positive controls for the analysis of stt3a-1 seedlings. Both stt3a-1 and stt3b-1 seedlings produced chimeric transcripts that were amplified with forward primer and T-DNA left border primer but not with primers for wild-type transcripts. (C) Chimeric stt3a-1 (top) and stt3b-1 (bottom) RT-PCR product and predicted amino acid sequences compared with wild-type sequences. The underlined sequence indicates the transcript region that originates from the inserted T-DNA.
Figure 8.
Figure 8.
Expression of STT3 Genes Is Not Regulated by Salt Stress. C24 and stt3a-1 plants inoculated onto medium with or without 160 mM NaCl for 4 days. Transcript levels for STT3a, STT3b, RD29a (a salt-responsive control gene), and ACT2 (a loading control) were analyzed by RT-PCR using 10 μg of total RNA extracted from shoots (S) or roots (R).
Figure 9.
Figure 9.
The stt3a-1 stt3b-1 Double Mutant Is Lethal at the Gamete Stage. The pollen and siliques produced from self-pollination of C24 wild-type (STT3a STT3b), stt3a-1 (stt3a-1 STT3b), and stt3a-1/+ stt3b-1/+ heter- ozygous plants were analyzed by light microscopy. Abnormal pollen found in stt3a-1/+ stt3b-1/+ pollen are indicated by closed arrowheads. Aborted ovules that failed to develop normally are labeled with open arrowheads. Bars = 0.025, 3, and 1 mm from top to bottom.
Figure 10.
Figure 10.
stt3a-1 Plants Are Defective in Protein Glycosylation. (A) Glycosylated proteins in crude extracts of wild-type (C24) and stt3a-1 plants were resolved by SDS-PAGE and detected by Con A lectin blot analysis in total proteins (left gel) and Con A binding proteins (CBPs; right gel). A major 65-kD protein (CBP65) in wild-type seedlings is identified by the arrowhead. The Con A blot was exposed longer to visualize a faint 60-kD band detected in the stt3a-1 plant extract. (B) Endoglycosidase H treatment resolves differences in protein glycosylation in wild-type (C24) and stt3a-1 plants. Proteins from crude extracts were absorbed onto Con A–Sepharose (Pharmacia Amersham), and the bound protein was recovered by elution with α-methylmannopyranoside. Fifteen micrograms of CBPs with or without deglycosylation treatment by endoglycosidase H (endoH) was analyzed by SDS-PAGE. Open arrowheads identify bands that are common in wild-type and stt3a-1 CBP fractions after endoglycosidase H treatment. (C) Alignment of the CBP65 N-terminal sequence with the Arabidopsis TGG1 (At5g26000) peptide sequence. Potential N-glycosylation motifs are underlined.
Figure 11.
Figure 11.
RNAi of STT3a Activates the UPR Based on Activation of the BiP Promoter. (A) Scheme of the STT3a gene-silencing cassette in pSTT3aR that was transformed into the ColBIP-GUS line. (B) GUS activity is illustrated in the root tip of wild-type (ColBIP-GUS) and pSTT3aR transgenic [ColBiP-GUS STT3a(RNAi)-1] plants. T2 transformants were subjected to 160 mM NaCl stress treatment as described for Figure 1 and then stained for GUS activity after 48 h. Tunicamycin treatment was administered by inoculating seedlings onto MS agar medium plus 0.3 mg/L tunicamycin 24 h before the GUS reaction was initiated. Bars = 1 mm (top) and 0.2 mm (bottom).

Similar articles

Cited by

References

    1. Alexander, M.R., Tyers, M., Perret, M., Craig, M., Fang, K.S., and Gustin, M. (2001). Regulation of cell cycle progression by Swe1p and Hog1p following hypertonic stress. Mol. Biol. Cell 12, 53–62. - PMC - PubMed
    1. Alvim, F.C., Carolino, S.M., Cascardo, J.C., Nunes, C.C., Martinez, C.A., Otoni, W.C., and Fontes, E.P. (2001). Enhanced accumulation of BiP in transgenic plants confers tolerance to water stress. Plant Physiol. 126, 1042–1054. - PMC - PubMed
    1. Andreasson, E., Bolt Jorgensen, L., Hoglund, A.S., Rask, L., and Meijer, J. (2001). Different myrosinase and idioblast distribution in Arabidopsis and Brassica napus. Plant Physiol. 127, 1750–1763. - PMC - PubMed
    1. Arnold, E., and Tanner, W. (1982). An obligatory role of protein glycosylation in the life cycle of yeast cells. FEBS Lett. 148, 49–53. - PubMed
    1. Benton, B.K., Plump, S.D., Roos, J., Lennarz, W.J., and Cross, F.R. (1996). Over-expression of S. cerevisiae G1 cyclins restores the viability of alg1 N-glycosylation mutants. Curr. Genet. 29, 106–113. - PubMed

Publication types

MeSH terms

Substances

Associated data