

Parallel analysis of transcript and metabolic profiles: a new approach in systems biology
- PMID: 12973302
- PMCID: PMC1326402
- DOI: 10.1038/sj.embor.embor944
Parallel analysis of transcript and metabolic profiles: a new approach in systems biology
Abstract
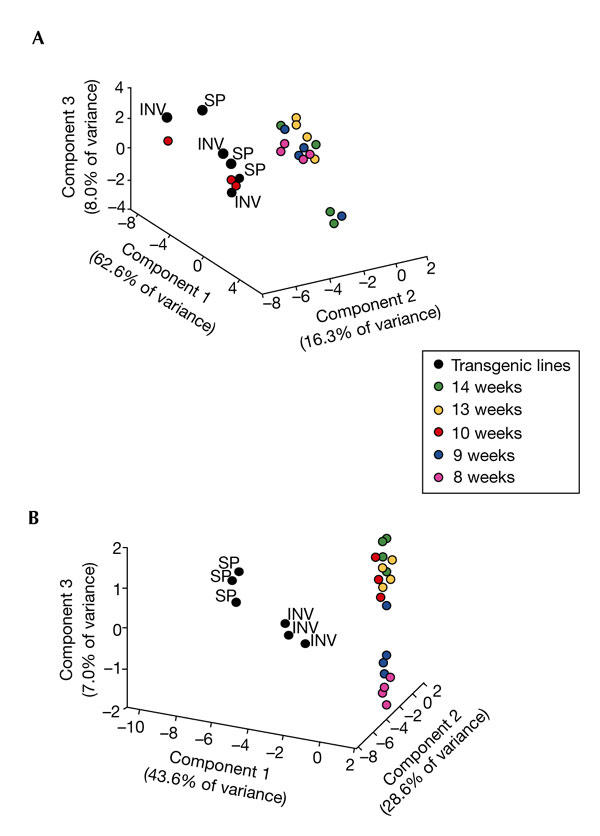
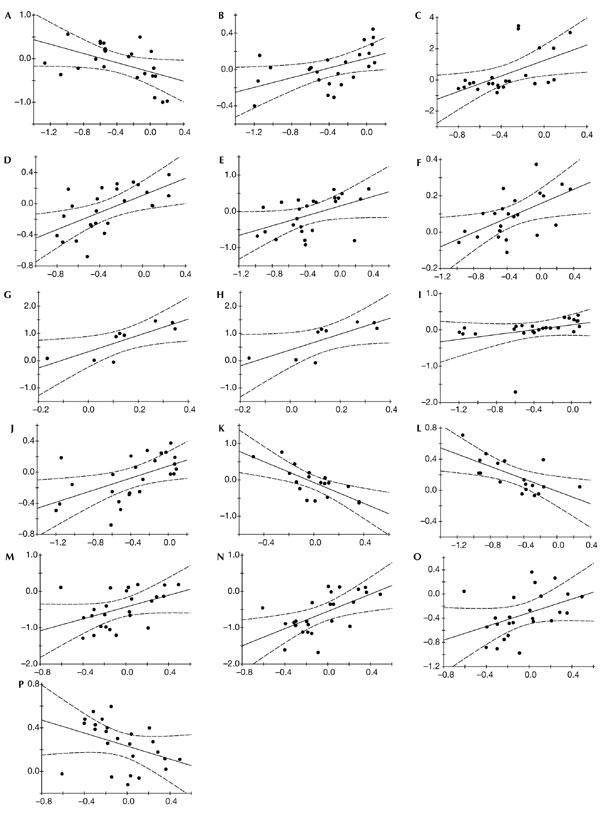
The past few years in the medical and biological sciences have been characterized by the advent of systems biology. However, despite the well-known connectivity between the molecules described by transcriptomic, proteomic and metabolomic approaches, few studies have tried to correlate parameters across the various levels of systemic description. When comparing the discriminatory power of metabolic and RNA profiling to distinguish between different potato tuber systems, using the techniques described here suggests that metabolic profiling has a higher resolution than expression profiling. When applying pairwise transcript-metabolite correlation analyses, 571 of the 26,616 possible pairs showed significant correlation, most of which was novel and included several strong correlations to nutritionally important metabolites. We believe this approach to be of high potential value in the identification of candidate genes for modifying the metabolite content of biological systems.
Figures
Comment in
-
Beyond the horizon.EMBO Rep. 2003 Oct;4(10):913. doi: 10.1038/sj.embor.embor945. EMBO Rep. 2003. PMID: 14528254 Free PMC article. No abstract available.
Similar articles
-
Integrating profiling data: using linear correlation to reveal coregulation of transcript and metabolites.Methods Mol Biol. 2007;358:77-85. doi: 10.1007/978-1-59745-244-1_5. Methods Mol Biol. 2007. PMID: 17035681
-
Heterologous microarray experiments allow the identification of the early events associated with potato tuber cold sweetening.BMC Genomics. 2008 Apr 16;9:176. doi: 10.1186/1471-2164-9-176. BMC Genomics. 2008. PMID: 18416834 Free PMC article.
-
Profiling of diurnal patterns of metabolite and transcript abundance in potato (Solanum tuberosum) leaves.Planta. 2005 Aug;221(6):891-903. doi: 10.1007/s00425-005-1483-y. Epub 2005 Mar 3. Planta. 2005. PMID: 15744496
-
Molecular and biochemical triggers of potato tuber development.Plant Physiol. 2001 Dec;127(4):1459-65. Plant Physiol. 2001. PMID: 11743089 Free PMC article. Review. No abstract available.
-
Classification of sarcomas using bioinformatics and molecular profiling.Curr Pharm Biotechnol. 2007 Apr;8(2):83-91. doi: 10.2174/138920107780487492. Curr Pharm Biotechnol. 2007. PMID: 17430156 Review.
Cited by
-
Rifaximin modulates the vaginal microbiome and metabolome in women affected by bacterial vaginosis.Antimicrob Agents Chemother. 2014 Jun;58(6):3411-20. doi: 10.1128/AAC.02469-14. Epub 2014 Apr 7. Antimicrob Agents Chemother. 2014. PMID: 24709255 Free PMC article.
-
Gene and metabolite regulatory network analysis of early developing fruit tissues highlights new candidate genes for the control of tomato fruit composition and development.Plant Physiol. 2009 Mar;149(3):1505-28. doi: 10.1104/pp.108.133967. Epub 2009 Jan 14. Plant Physiol. 2009. PMID: 19144766 Free PMC article.
-
Novel approaches for the taxonomic and metabolic characterization of lactobacilli: Integration of 16S rRNA gene sequencing with MALDI-TOF MS and 1H-NMR.PLoS One. 2017 Feb 16;12(2):e0172483. doi: 10.1371/journal.pone.0172483. eCollection 2017. PLoS One. 2017. PMID: 28207855 Free PMC article.
-
Exploration of serum metabolomic profiles and outcomes in women with metastatic breast cancer: a pilot study.Mol Oncol. 2012 Aug;6(4):437-44. doi: 10.1016/j.molonc.2012.05.003. Epub 2012 Jun 1. Mol Oncol. 2012. PMID: 22687601 Free PMC article.
-
Transcriptomic and Metabolomic Changes Triggered by Fusarium solani in Common Bean (Phaseolus vulgaris L.).Genes (Basel). 2020 Feb 7;11(2):177. doi: 10.3390/genes11020177. Genes (Basel). 2020. PMID: 32046085 Free PMC article.
References
-
- Colebatch G. et al. . ( 2002) Novel aspects of symbiotic nitrogen fixation uncovered by transcript profiling with cDNA arrays. Mol. Plant Microbe Interact., 15, 411–420. - PubMed
-
- Facchini P.J., Huber-Allanach K.L. & Tari L.W. ( 2000) Plant aromatic L-amino acid decarboxylases: evolution, biochemistry, regulation, and metabolic engineering applications. Phytochemistry, 54, 121–138. - PubMed
-
- Fernie A.R., Willmitzer L. & Trethewey R.N. ( 2002) Sucrose to starch: a transition in molecular plant physiology. Trends Plant Sci., 7, 35–42. - PubMed
-
- Fiehn O., Kopka J., Dormann P., Altmann T., Trethewey R.N. & Willmitzer L. ( 2000) Metabolite profiling for plant functional genomics. Nature Biotechnol., 18, 1157–1161. - PubMed
Publication types
MeSH terms
LinkOut - more resources
Full Text Sources
Other Literature Sources
Miscellaneous
