. 2003 Oct;134(1):127-37.
doi: 10.1046/j.1365-2249.2003.02268.x.

Over-expression of interleukin 10 in mucosal T cells of patients with active ulcerative colitis

Affiliations

Over-expression of interleukin 10 in mucosal T cells of patients with active ulcerative colitis

S Melgar et al. Clin Exp Immunol. 2003 Oct.

Abstract

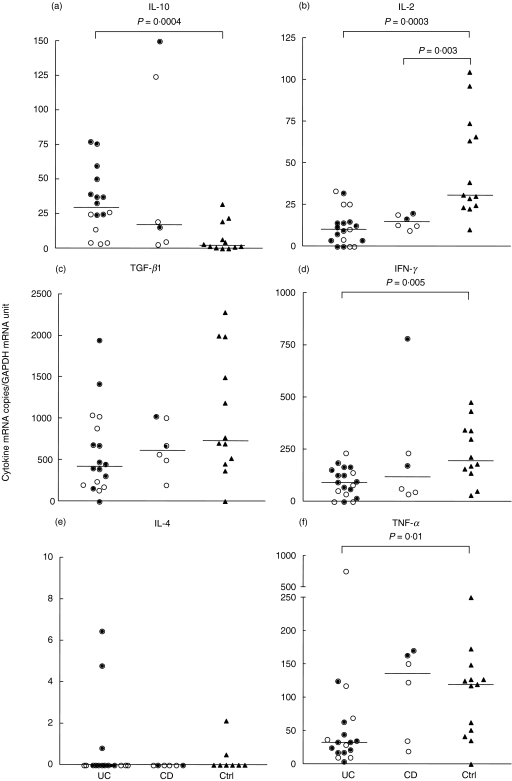
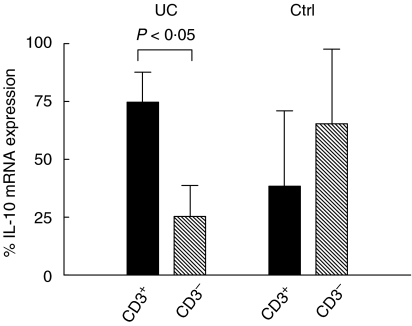
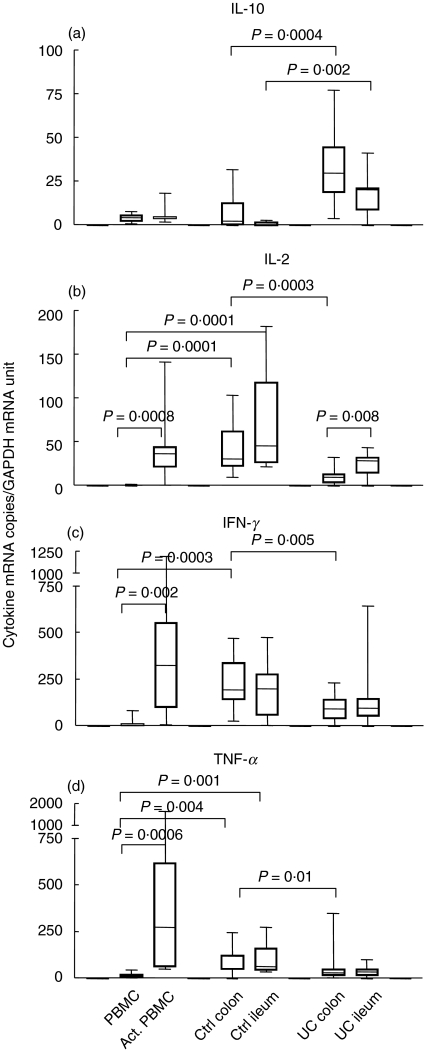
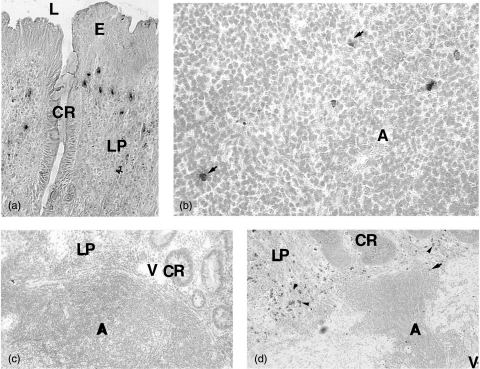
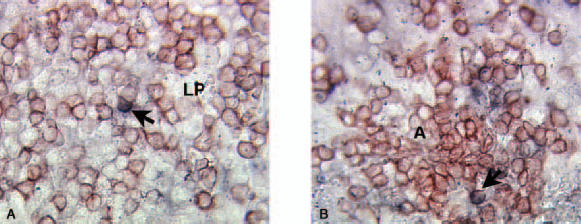
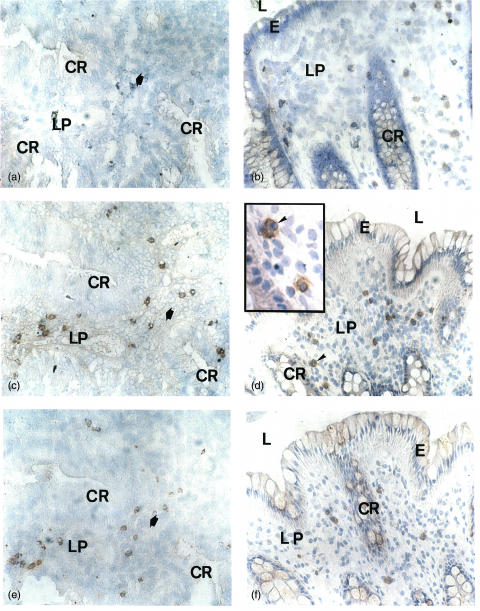
Ulcerative colitis (UC), a chronic inflammatory bowel disease, exhibits pronounced increase of T lymphocytes in the inflamed mucosa. To understand the role of intestinal T lymphocytes in the pathogenesis of UC their cytokine production in the mucosa was analysed. Intestinal T lymphocytes of UC, Crohn's disease and control patients were analysed for cytokine mRNA levels by real-time quantitative reverse transcription-polymerase chain reaction (RT-PCR) directly after isolation without in vitro stimulation. Frequencies of cytokine positive cells were determined in UC and control colon by immunomorphometry. T lymphocytes in normal colon expressed interleukin (IL)-2, interferon (IFN)-gamma, tumour necrosis factor (TNF)-alpha and transforming growth factor (TGF)-beta1, but not IL-4, IL-5 or IL-10. In UC, a highly significant increase in IL-10 mRNA levels in T lymphocytes and an increased frequency of IL-10 positive cells was seen in colon. IL-10 mRNA levels were also elevated in T lymphocytes of the non-inflamed ileum and correlated with disease activity at both locations. CD4+ T lymphocytes were the major source of IL-10 mRNA. IL-2, IFN-gamma and TNF-alpha mRNA levels were decreased in colonic T lymphocytes, and virtually no IL-2, IFN-gamma, TNF-alpha or TGF-beta positive cells were detected in basal lymphoid aggregates. However, scattered IL-10 positive cells were found here. Lamina propria outside the aggregates contained IL-10-, IFN-gamma, TNF-alpha and TGF-beta but not IL-2 positive cells. T cells of UC patients did not express IL-4 or IL-5. Taken, together the data suggest a generalized activation of IL-10 producing CD4+ T cells along the intestine of UC patients. The local environment seems to determine the biological consequences of elevated IL-10.


Figures

Fig. 1
Fig. 1
IL-10 (a), IL-2 (b), TGF-β1 (c), IFN-γ(d), IL-4 (e) and TNF-α(f) mRNA levels in freshly isolated colonic lamina propria T lymphocytes, CD3+ LPL, of ulcerative colitis patients (UC), patients with Crohn's disease (CD) and control patients (Ctrl). The amounts of cytokine mRNA and GAPDH mRNA were determined using the quantitative TaqMan EZ real time quantitative RT-PCR technology. The average level of cytokine mRNA/T cell was calculated as the ratio between the concentration of cytokine mRNA copies and GAPDH mRNA units in each sample. For the different cytokines each circle or triangle represents the value from a single subject. Filled circles indicate samples from patients with active colitis. Open circles indicate samples from patients with inactive colitis. Triangles indicate samples from controls. Horizontal bars indicate medians. Statistically significant differences with P-values ≤ 0·01 are indicated. (Mann–Whitney's ranking test).
Fig. 2
Fig. 2
Relative contribution by T cells and non-T cell leucocytes to IL-10 mRNA in the colonic lamina propria of UC patients and controls. T cells were positively selected from freshly isolated colonic LPL of four UC patients and three controls (Ctrl) and IL-10 mRNA amounts were determined in bound (CD3+; black columns) and unbound (CD3; hatched columns) LPL. The amount of IL-10 mRNA was determined as described in Fig. 1 and percentage IL-10 mRNA expression was calculated for the individual samples as [amount of IL-10 mRNA in the indicated cell type/(amount of IL-10 mRNA in CD3+ LPL + CD3 LPL)] × 100. Columns indicate mean ± 1 S.D. Student's t-test was used for statistical analysis.
Fig. 3
Fig. 3
IL-10 (a), IL-2 (b), IFN-γ(c) and TNF-α(d) mRNA levels in freshly isolated mononuclear cells from blood (PBMC), PBMC activated for 7 h with anti-CD3 MoAb (Act. PBMC) and freshly isolated lamina propria T lymphocytes, CD3+ LPL, from colon and ileum of control patients (Ctrl colon, Ctrl ileum) and of ulcerative colitis patients (UC colon, UC ileum). The cytokine mRNA levels were determined as described in Fig. 1. Whiskers indicate the range, boxes the 25th to 75th percentile and horizontal bars inside boxes the median values. Presented results are based on analysis of seven to nine PBMC samples, seven to nine samples of activated PBMC, 12 or 13 control colon samples, eight control ileum samples, 16–19 UC colon samples and 14–17 UC ileum samples for each cytokine. Statistically significant differences with P-values ≤ 0·01 are indicated. (Mann–Whitney's ranking test).
Fig. 4
Fig. 4
Immunohistochemical staining of IL-10 (a, b), IL-2 (c) and IFN-γ (d) in the colonic mucosa of UC patients. (a) Several IL-10 positive cells are present in the lamina propria. (b) Scattered IL-10 stained cells can be seen in the lymphoid aggregate (arrows). (c) No IL-2 stained cells are found in any compartment. (d) Only one IFN-γ positive cell (arrow) can be seen in the lymphoid aggregate while several IFN-γ positive cells are present in lamina propria outside the aggregate (arrow heads). A = lymphoid aggregate; CR = crypt; E = epithelium; L = lumen; LP = lamina propria; V = blood vessel. Original magnification ×55 in (a); ×220 in (b); ×55 in (c, d).
Fig. 5
Fig. 5
Immunohistochemical double staining of IL-10 (blue) and CD3 (red) in the colonic mucosa of UC patient. (a) A double positive cell (thick arrow) in the lamina propria outside basal lymphoid aggregate among several single stained CD3+ cells. (b) A double positive cell (thick arrow) in the T cell area of a basal lymphoid aggregate. For abbreviations see Fig. 4. Original magnification ×220.
Fig. 6
Fig. 6
Immunohistochemical staining for IL-2 (a, b), TGF-β (c, d) and IFN-γ (e, f) in the colonic mucosa of an UC patient (a, c, e) and a control patient (b, d, f); (a), (c) and (e) show sequential sections of UC. The bold arrow indicates an equivalent position in the sections. For abbreviations see Fig. 4. Counterstained with Mayer's haematoxylin. Original magnification ×51 in (a, b, c, d, e, f), and ×128 in the insert in (d).

Similar articles

Cited by

References

    1. Fiocchi C. Inflammatory bowel disease. Etiol Pathogen Gastroenterol. 1998;115:182–505. - PubMed
    1. Halstensen TS, Mollnes TE, Garred P, Fausa O, Brandtzaeg P. Epithelial deposition of immunoglobulin G1 and activated complement (C3b and terminal complement complex) in ulcerative colitis. Gastroenterology. 1990;98:1264–71. - PubMed
    1. Kozarek RA. Review article: immunosuppressive therapy for inflammatory bowel disease. Aliment Pharmacol Ther. 1993;7:117–23. - PubMed
    1. Boismenu R, Chen Y. Insights from mouse models of colitis. J Leukoc Biol. 2000;67:267–78. - PubMed
    1. Powrie F, Leach MW, Mauze S, Caddle LB, Coffman RL. Phenotypically distinct subsets of CD4+ T cells induce or protect from chronic intestinal inflammation in C.B-17 Scid mice. Int Immunol. 1993;11:1461–71. - PubMed

Publication types

MeSH terms