Comparative Study
. 2003 Oct;13(10):2291-305.
doi: 10.1101/gr.1349003. Epub 2003 Sep 15.

Representational oligonucleotide microarray analysis: a high-resolution method to detect genome copy number variation

Affiliations
Comparative Study

Representational oligonucleotide microarray analysis: a high-resolution method to detect genome copy number variation

Robert Lucito et al. Genome Res. 2003 Oct.

Abstract

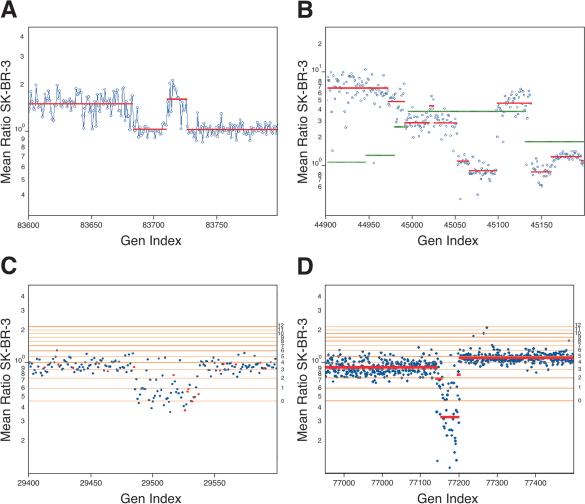
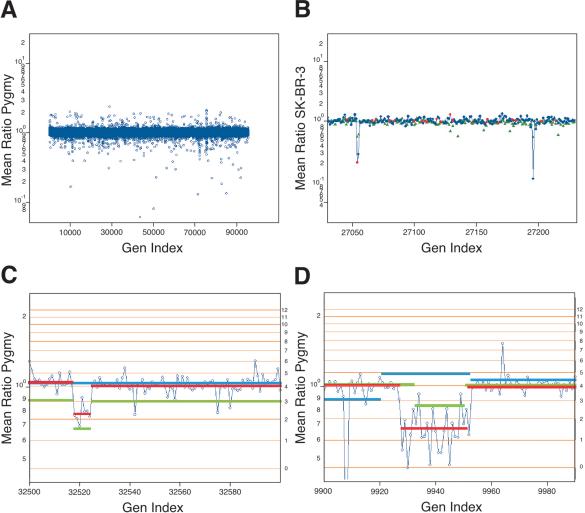
We have developed a methodology we call ROMA (representational oligonucleotide microarray analysis), for the detection of the genomic aberrations in cancer and normal humans. By arraying oligonucleotide probes designed from the human genome sequence, and hybridizing with "representations" from cancer and normal cells, we detect regions of the genome with altered "copy number." We achieve an average resolution of 30 kb throughout the genome, and resolutions as high as a probe every 15 kb are practical. We illustrate the characteristics of probes on the array and accuracy of measurements obtained using ROMA. Using this methodology, we identify variation between cancer and normal genomes, as well as between normal human genomes. In cancer genomes, we readily detect amplifications and large and small homozygous and hemizygous deletions. Between normal human genomes, we frequently detect large (100 kb to 1 Mb) deletions or duplications. Many of these changes encompass known genes. ROMA will assist in the discovery of genes and markers important in cancer, and the discovery of loci that may be important in inherited predispositions to disease.


Figures

Figure 1
Figure 1
The predictability of informatics and accuracy of the array measurements using 10K microarrays. (A) The results, where the samples hybridized are BglII representation and BglII representation depleted of fragments with a HindIII cleavage site. The Y-axis (Mean Ratio) is the mean measured ratio from two hybridizations of depleted representation to normal representation plotted in log scale. The X-axis (Index) is a sorted index, such that those probes that derive fromfragments that do not have an internal HindIII restriction cleavage site sort first and those with an internal HindIII site sort last. This allows the separation of these two subsets for visualization of the cleavage results. (B) The reproducibility of the duplicate experiments used to generate the average ratio in A. The Y-axis (Ratio Exp1) is the measured ratio from experiment 1, and the X-axis (Ratio Exp2) is the measured ratio of experiment 2. Both axes are plotted in log scale. (C) Graph of the normalized ratio on the Y-axis as a function of intensity of the sample that was not depleted on the X-axis. Both the ratio and intensity were plotted in log scale. (D) Data generated by simulation. The X-axis (Index) is a false index. Probes, in groups of 600, detect increasing copy number, from left to right; 600 flanking probes detect normal copy number. The Y-axis (Mean Ratio) is the mean ratio calculated from two hybridizations.
Figure 2
Figure 2
The genomic profiles for (A) a primary breast cancer sample (CHTN159), with aneuploid nuclei compared with diploid nuclei from the same patient; (B) a breast cancer cell line compared with a normal male reference; and (C) a normal male compared with a normal male reference, using the 10K printed array (A1,B1,C1) and the 85K photoprint array (A2,B2,C2). In each case (rows 1 and 2), the Y-axis is the mean ratio, and the X-axis (Gen Index) is an index of the probes' genomic order based on the June 2002 assembly, that is, NCBI Build 30. The probes were put into genomic order concatenating Chromosomes 1 through Y. (A3,B3,C3) The correspondence of the ratios measured from “brother” probes (see text for details) present in the 10K and the 85K microarrays. The Y-axis is the measured ratio from the 10K microarray, and the X-axis is the measured ratio from the 85K microarray.
Figure 3
Figure 3
Several chromosomes with varying copy number fluctuations from analysis of the tumor cell line SK-BR-3 as compared with the normal reference. The Y-axis (Mean Ratio) represents the mean ratio of two hybridizations in log scale. The X-axis (Gen Index) is an index of the genomic coordinates, as described above. (A) Copy number fluctuations identified for Chromosome 5, (B) for Chromosome 8, (C) for Chromosome 17, and (D) for the X-chromosome.
Figure 4
Figure 4
The mean segmentation calculated from the analysis of SK-BR-3 compared with (A,B) the normal reference and (C,D) CHTN159. In all panels, the Y-axis is the value of the mean segment for each probe in log scale. In A and C, the X-axis (Mean Segment Index) is in ascending value of the assigned mean segment. In B and D, the X-axis (Gen Index) is the genomic index, as described above. Plotted on top of the mean segment data is a copy number lattice extrapolated from the array data using formulas within the text (horizontal lines). The calculated copy number for each horizontal line is to the right of the lattice.
Figure 5
Figure 5
In all panels, the Y-axis (Mean Ratio SK-BR-3) is the mean ratio of two hybridizations of SK-BR-3 compared with a normal reference in log scale. The X-axis (Gen Index) is the genomic index, as described. (A) A region from the X-chromosome with a region of loss. Plotted over the measured array ratio is the calculated segmentation value. (B) A region of Chromosome 8 (c-myc located to the right of the center of the graph) from results of SK-BR-3 in comparison to normal reference. Plotted on top of the data are the segmentation values for SK-BR-3 in comparison to the normal reference in red and the segmentation values for the primary tumor CHTN159 in green. (C) A lesion on Chromosome 5 demonstrating the resolving power of the 85K as compared with the 10K array. Results are from SK-BR-3 compared with a normal reference. Spots in red are from the 10K printed microarray, and spots in blue are from the 85K photoprint array. Horizontal lines are copy number estimates, based on modeling from mean-segment values. (D) Comparison of SK-BR-3 to normal reference, displaying a region of homozygous deletion on Chromosome 19. The mean-segment value is plotted as a red line, and horizontal lines are copy number estimates as described.
Figure 6
Figure 6
(A) The results of a normal genomic profile compared with a normal, identical to that displayed in Figure 2C2 with the exception that singlet probes have been filtered as described in the text. (B) The serial comparison of experiments for a small region from Chromosome 4. The Y-axis is the mean ratio in log scale. The X-axis is the genomic index, as described. The blue (85K) and red (10K) spots are from the comparison of SK-BR-3 to normal. The green is a comparison of a pygmy to the normal reference. (C) A lesion found in the normal population on Chromosome 6. The blue spots are plotted by mean ratio for analysis of the pygmy to the normal reference. The red line is the mean-segment value for the pygmy-to-normal reference comparison. The green line is the mean-segment value for the SK-BR-3-to-normal reference comparison. The blue line is the segment value from the primary tumor (CHTN159 aneuploid to diploid) comparison. (D) A region of Chromosome 2. The data shown in blue circles are from the comparison of SK-BR-3 to the normal reference. The mean-segment line for this comparison is shown in green. The mean-segment line for the comparison of a pygmy to the normal reference is shown in red and for the primary tumor CHTN159 in blue. For C and D, the calculated copy number for the horizontal lines is found to the right of the panel.

References

    1. Bartlett, J. and Mallon, E.C.T. 2003. The clinical evaluation of HER-2 status: Which test to use? J. Pathology 199: 418-423. - PubMed
    1. Chee, M., Yang, R., Hubbell, E., Berno, A., Huang, X.C., Stern, D., Winkler, J., Lockhard, D.J., Morris, M.S., and Fodor, S.P. 1996. Accessing genetic information with high-density DNA arrays. Science 274: 610-614. - PubMed
    1. DeRisi, J., Penland, L., Brown, P.O., Bittner, M.L., Meltzer, P.S., Ray, M., Chen, Y., Su, Y.A., and Trent, J.M. 1996. Use of a cDNA microarray to analyse gene expression patterns in human cancer. Nat. Genet. 14: 457-460. - PubMed
    1. Gemmill, R.M., West, J.D., Boldog, F., Tanaka, N., Robinson, L.J., Smith, D.I., Li, F., and Drabkin, H.A. 1998. The hereditary renal cell carcinoma 3;8 translocation fuses FHIT to a patched-related gene, TRC8. Proc. Natl. Acad. Sci. 95: 9572-9577. - PMC - PubMed
    1. Golub, T.R., Slonim, D.K., Tamayo, P., Huard, C., Gaasenbeek, M., Mesirov, J.P., Coller, H., Loh, M.L., Downing, J.R., Caligiuri, M.A., et al. 1999. Molecular classification of cancer: Class discovery and class prediction by gene expression monitoring. Science 286: 531-537. - PubMed

WEB SITE REFERENCES

    1. http://roma.cshl.org/; ROMA.

Publication types

MeSH terms

Substances

LinkOut - more resources