. 2003 Oct 1;17(19):2436-49.
doi: 10.1101/gad.1096603. Epub 2003 Sep 15.

Synoviolin/Hrd1, an E3 ubiquitin ligase, as a novel pathogenic factor for arthropathy

Affiliations

Synoviolin/Hrd1, an E3 ubiquitin ligase, as a novel pathogenic factor for arthropathy

Tetsuya Amano et al. Genes Dev. .

Abstract

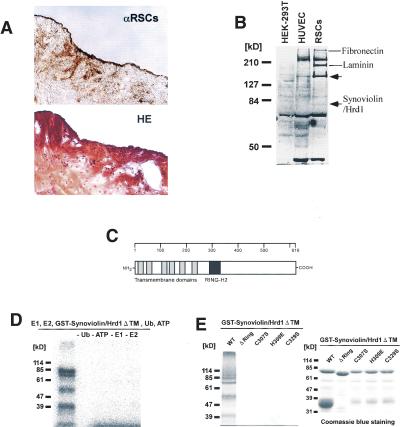
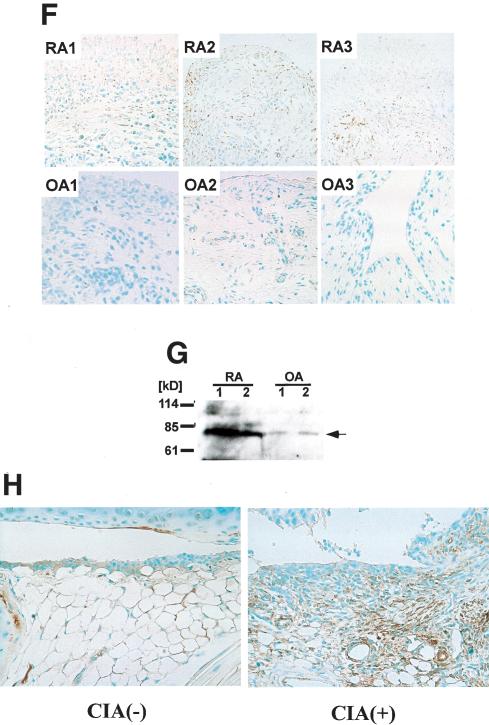
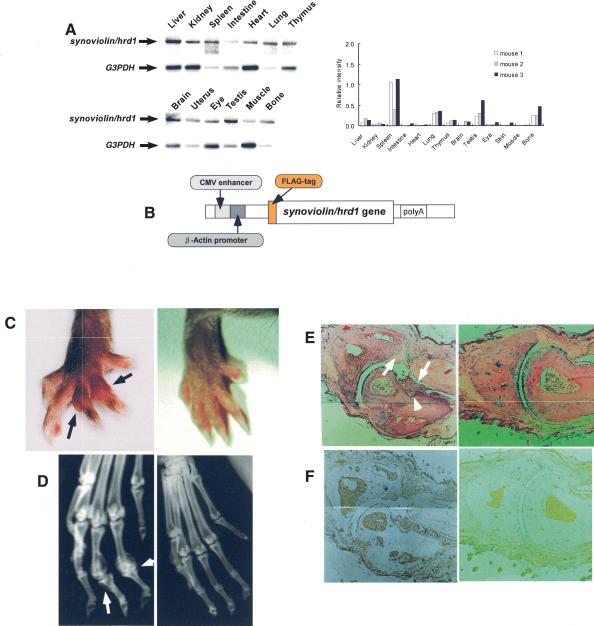
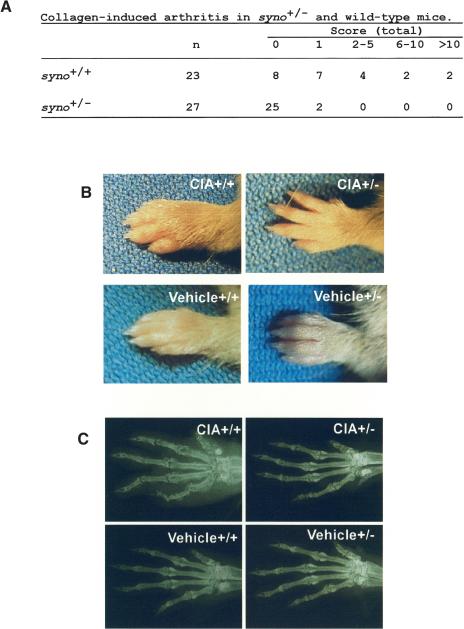
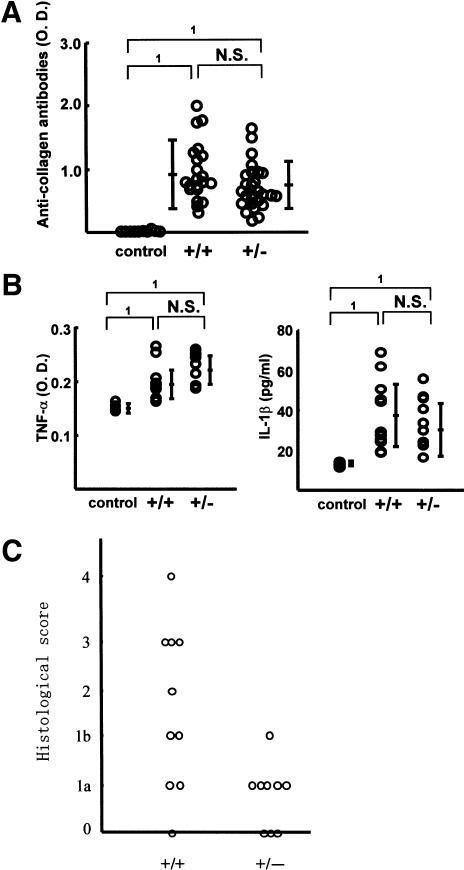
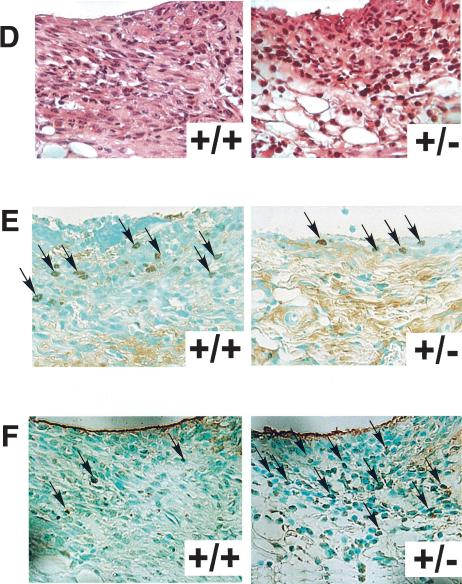
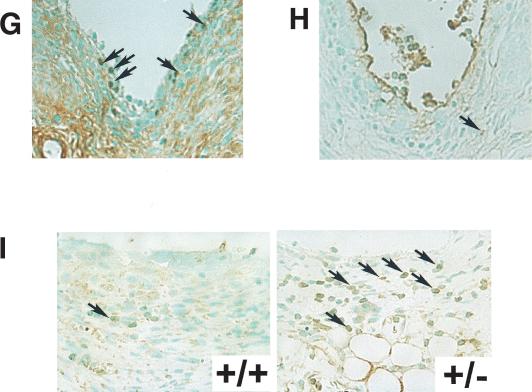
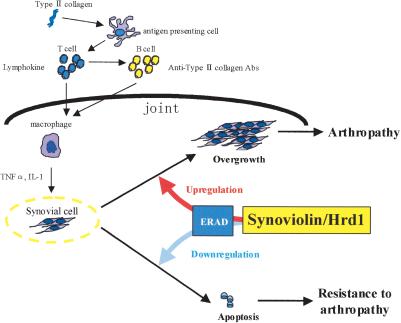
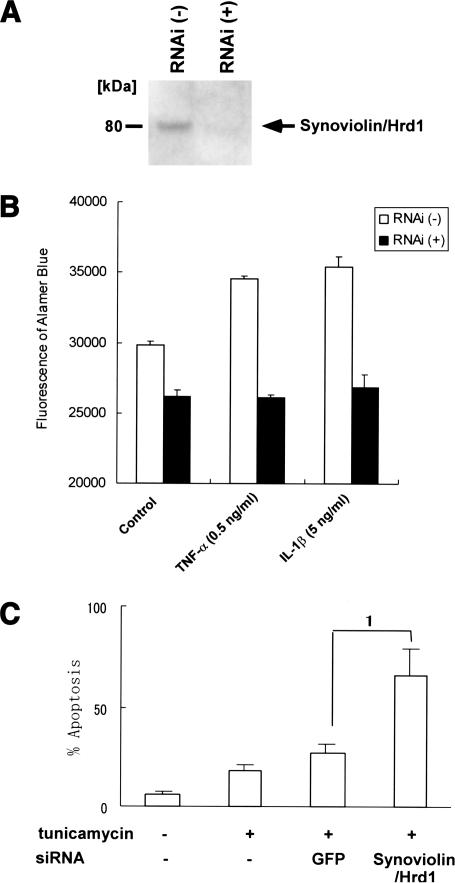
Rheumatoid arthritis (RA) is one of the most critical articular diseases with synovial hyperplasia followed by impairment of quality of life. However, the mechanism(s) that regulates synovial cell outgrowth is not fully understood. To clarify its mechanism(s), we carried out immunoscreening by using antirheumatoid synovial cell antibody and identified and cloned "Synoviolin/Hrd1", an E3 ubiquitin ligase. Synoviolin/Hrd1 was highly expressed in the rheumatoid synovium, and mice overexpressing this enzyme developed spontaneous arthropathy. Conversely, synoviolin/hrd1(+/-) mice were resistant to collagen-induced arthritis by enhanced apoptosis of synovial cells. We conclude that Synoviolin/Hrd1 is a novel causative factor for arthropathy by triggering synovial cell outgrowth through its antiapoptotic effects. Our findings provide a new pathogenetic model of RA and suggest that Synoviolin/Hrd1 could be targeted as a therapeutic strategy for RA.


Figures

Figure 1.
Figure 1.
Molecular cloning and characterization of Synoviolin/Hrd1. (A, top) Immunostaining of synovial tissue derived from RA patient by anti-RSCs antibody. (Bottom) Hematoxylin and eosin (HE) staining of synovial tissue derived from the same patient. (B) Western blot analysis using anti-RSCs antibody. Arrows show the RSCs-specific bands. Molecular weights of the specific bands are ∼140 and 83 kD from the top. A 83-kD protein was presumed to be Synoviolin/Hrd1. (HEK-293T) Human embryonic kidney-293T cells; (HUVEC) human umbilical vein endothelial cells. (C) Linear arrangement of Synoviolin/Hrd1. The scale above provides amino acid number. (D) E1- and E2-dependent E3 ubiquitin ligase activity of GST-Synoviolin/Hrd1 ΔTM. Reactions were carried out with removed individual components (e.g., E1, E2). (E, left) Synoviolin/Hrd1 RING finger mutants could not mediate auto-ubiquitination. (Right) GST-Synoviolin/Hrd1ΔTM and RING finger mutants were resolved by SDS-PAGE followed by Coomassie blue staining. There are multiple bands for degradation products of GST-Synoviolin/Hrd1 ΔTM and its mutants. (F) Immunostaining of synovial tissues from RA (top) and OA (bottom) patients by anti-Synoviolin/Hrd1 monoclonal antibody. Representative pictures from RA (n = 5) and OA (n = 5). (G) Western blot analysis using anti-Synoviolin/Hrd1 monoclonal antibody. Lysates prepared from synovial cells derived from RA and OA patients. Arrow indicates endogenous Synoviolin/Hrd1 protein. Representative pictures from RA (n = 5) or OA (n = 5). (H) Immunostaining of synovial tissues in knee joint of control (left) and CIA (right) mouse by anti-Synoviolin/Hrd1 monoclonal antibody. Magnification: A,F, 100×.
Figure 1.
Figure 1.
Molecular cloning and characterization of Synoviolin/Hrd1. (A, top) Immunostaining of synovial tissue derived from RA patient by anti-RSCs antibody. (Bottom) Hematoxylin and eosin (HE) staining of synovial tissue derived from the same patient. (B) Western blot analysis using anti-RSCs antibody. Arrows show the RSCs-specific bands. Molecular weights of the specific bands are ∼140 and 83 kD from the top. A 83-kD protein was presumed to be Synoviolin/Hrd1. (HEK-293T) Human embryonic kidney-293T cells; (HUVEC) human umbilical vein endothelial cells. (C) Linear arrangement of Synoviolin/Hrd1. The scale above provides amino acid number. (D) E1- and E2-dependent E3 ubiquitin ligase activity of GST-Synoviolin/Hrd1 ΔTM. Reactions were carried out with removed individual components (e.g., E1, E2). (E, left) Synoviolin/Hrd1 RING finger mutants could not mediate auto-ubiquitination. (Right) GST-Synoviolin/Hrd1ΔTM and RING finger mutants were resolved by SDS-PAGE followed by Coomassie blue staining. There are multiple bands for degradation products of GST-Synoviolin/Hrd1 ΔTM and its mutants. (F) Immunostaining of synovial tissues from RA (top) and OA (bottom) patients by anti-Synoviolin/Hrd1 monoclonal antibody. Representative pictures from RA (n = 5) and OA (n = 5). (G) Western blot analysis using anti-Synoviolin/Hrd1 monoclonal antibody. Lysates prepared from synovial cells derived from RA and OA patients. Arrow indicates endogenous Synoviolin/Hrd1 protein. Representative pictures from RA (n = 5) or OA (n = 5). (H) Immunostaining of synovial tissues in knee joint of control (left) and CIA (right) mouse by anti-Synoviolin/Hrd1 monoclonal antibody. Magnification: A,F, 100×.
Figure 2.
Figure 2.
Overexpression of human Synoviolin/Hrd1 in mice causes arthropathy. (A) Northern blot analysis of synoviolin/hrd1. Total RNA was prepared from 7-week-old DBA1/J mice. Fifteen micrograms of total RNA was loaded per lane. Hybridization with G3PDH was used as control. Autoradiographs are shown on the left. The bar graphs on the right show the mRNA expression levels of synoviolin/hrd1 relative to those of G3PDH in mice (n = 3). (B) Schematic representation of human synoviolin/hrd1 transgene for overexpressing mice study. (C) Photograph of the hindlimbs of representative Synoviolin/Hrd1-overexpressing (left) and wild-type (right) mice. Arrows indicate joint swelling. (D) Soft X-ray photographs of hindlimbs of representative Synoviolin/Hrd1-overexpressing (left) and wild-type (right) mice. Arrows indicate bone destruction. (E) Sagittal sections of toe joint from Synoviolin/Hrd1-overexpressing (left) and wild-type (right) mice stained with hematoxylin and eosin. Synovial hyperplasia (arrows) and bone destruction (arrow-heads) are evident. Magnification, 100×. (F) Immunostaining of toe joints with anti-Flag antibody (brown) in Synoviolin/Hrd1-overexpressing (left) and wild-type (right) mice. Magnification, 100×.
Figure 3.
Figure 3.
Targeted disruption of the synoviolin/hrd1 gene. (A) Structures of the synoviolin/hrd1 wild-type allele, the targeting vector, targeted allele, and the partial restriction map of the genes before and after targeting events. Exons of the gene are shown as closed boxes, and the β-galactosidase gene (LacZ), neomycin phosphotransferase gene (Neo), diphtheria toxin-A gene (DT), and pBluescript II (BSK) are shown as open boxes. The restriction sites used are as follows: (B) BglII; (P) PstI; (E) EcoRI; (X) XhoI; and (N) NcoI. (B) Southern blot analysis of genomic DNA extracted from E13.0 embryos generated by intercrosses of syno+/-. The DNA were digested with PstI (left) or BglII (right) and probed with an external probe. (C) Northern blot analysis. Twenty micrograms of total RNA, isolated from E13.0 embryos generated by intercrosses of syno+/-, hybridized with the probe for synoviolin/hrd1 or G3PDH probe. (D) The E13.0 embryos total protein was isolated and separated by SDS-PAGE (50 μg protein/lane). After transfer of the protein, the membrane was probed with anti-Synoviolin/Hrd1 antibody.
Figure 4.
Figure 4.
The syno+/- are resistant to collagen-induced arthritis. (A) Arthritis score of collagen-induced arthritis in syno+/+ and syno+/-. (B) Photograph of the forelimb in representative CIA-syno+/+ and CIA-syno+/-. Bottom panels show vehicle controls. (C) Soft X-ray photographs of the forelimb of representative CIA-syno+/+ and CIA-syno+/-. Bottom panels show vehicle controls.
Figure 5.
Figure 5.
Pathological analysis of collagen-induced arthritis. (A) Serum anti-type II collagen antibody levels in syno+/+ and syno+/- were measured by ELISA on day 21 after the second immunization with type II collagen. Data are expressed as mean ± S.D. (1) p < 0.01; (N.S.) not significant. (B) Serum TNFα (left) and IL-1β (right) levels were measured by ELISA on day 21 after the second immunization. Data are expressed as mean ± S.D. (1) p < 0.01; (N.S.) not significant. (C) Histological arthritis score of collagen-induced arthritis in syno+/+ and syno+/- mice. (D) Sagittal sections of synovia from CIA-syno+/+ and CIA-syno+/- mice, stained with hematoxylin and eosin. (E) PCNA staining (arrows) of the synovium in CIA-syno+/+ and CIA-syno+/- mice. There is no statistical significance between both groups. (F) TUNEL staining (arrows) of the synovium in CIA-syno+/+ and CIA-syno+/- mice. (G) PCNA staining (arrows) of the synovium in Synoviolin/Hrd1-overexpressing mice. (H) TUNEL staining (arrows) of the synovium in Synoviolin/Hrd1-overexpressing mice. (I) ATF6 staining (arrows) of the synovium in syno+/+ and syno+/- mice after CIA. Arrows indicate positive nuclear staining of PCNA, TUNEL, or ATF6. Magnification: D-I, 400×.
Figure 5.
Figure 5.
Pathological analysis of collagen-induced arthritis. (A) Serum anti-type II collagen antibody levels in syno+/+ and syno+/- were measured by ELISA on day 21 after the second immunization with type II collagen. Data are expressed as mean ± S.D. (1) p < 0.01; (N.S.) not significant. (B) Serum TNFα (left) and IL-1β (right) levels were measured by ELISA on day 21 after the second immunization. Data are expressed as mean ± S.D. (1) p < 0.01; (N.S.) not significant. (C) Histological arthritis score of collagen-induced arthritis in syno+/+ and syno+/- mice. (D) Sagittal sections of synovia from CIA-syno+/+ and CIA-syno+/- mice, stained with hematoxylin and eosin. (E) PCNA staining (arrows) of the synovium in CIA-syno+/+ and CIA-syno+/- mice. There is no statistical significance between both groups. (F) TUNEL staining (arrows) of the synovium in CIA-syno+/+ and CIA-syno+/- mice. (G) PCNA staining (arrows) of the synovium in Synoviolin/Hrd1-overexpressing mice. (H) TUNEL staining (arrows) of the synovium in Synoviolin/Hrd1-overexpressing mice. (I) ATF6 staining (arrows) of the synovium in syno+/+ and syno+/- mice after CIA. Arrows indicate positive nuclear staining of PCNA, TUNEL, or ATF6. Magnification: D-I, 400×.
Figure 7.
Figure 7.
Role of Synoviolin/Hrd1 in collagen-induced arthritis. Immunization using type II collagen evokes immunological processes followed by production of anti-type II collagen antibodies, which are thought to result in joint inflammation. Activated macrophages secrete cytokines, such as TNFα and IL-1β, which stimulate synovial cell proliferation. Because both antibody and cytokine productions are not impaired in syno+/-, it is conceivable that Synoviolin/Hrd1 is involved in synovial cell overgrowth. Our results indicate that Synoviolin/Hrd1 regulates the activity of ERAD system and, consequently, controls synovial cell apoptosis.
Figure 6.
Figure 6.
Down-regulation of Synoviolin/Hrd1 expression by siRNA reduces cell growth of RSCs. (A) Western blot analysis of whole-cell extracts from control and siRNA-transfected RSCs by using anti-Synoviolin/Hrd1 antibody. (B) RSCs were transfected with siRNA for 3 d and treated with various cytokines for additional 7 d. Cell growth assays were performed by using Alamar blue. (C) RSCs were transfected with siRNA for 3 d and treated with tunicamycin for additional 48 h. Apoptotic cells were detected by TUNEL staining, and the percentage of apoptotic cells were presented as mean ± S.D. (1) p < 0.05.

Similar articles

Cited by

References

    1. Aarvak T. and Natvig, J.B. 2001. Cell-cell interactions in synovitis: Antigen presenting cells and T cell interaction in rheumatoid arthritis. Arthritis Res. 3: 13-17. - PMC - PubMed
    1. Aono H., Fujisawa, K., Hasunuma, T., Marriott, S.J., and Nishioka, K. 1998. Extracellular human T cell leukemia virus type I tax protein stimulates the proliferation of human synovial cells. Arthritis Rheum. 41: 1995-2003. - PubMed
    1. Arend W.P. 2001. Physiology of cytokine pathways in rheumatoid arthritis. Arthritis Rheum. 45: 101-106. - PubMed
    1. Bays N.W., Gardner, R.G., Seelig, L.P., Joazeiro, C.A., and Hampton, R.Y. 2001. Hrd1p/Der3p is a membrane-anchored ubiquitin ligase required for ER-associated degradation. Nat. Cell Biol. 3: 24-29. - PubMed
    1. Bence N.F., Sampat, R.M., and Kopito, R.R. 2001. Impairment of the ubiquitin-proteasome system by protein aggregation. Science 292: 1552-1555. - PubMed

Publication types

MeSH terms