

Clustering of multiple specific genes and gene-rich R-bands around SC-35 domains: evidence for local euchromatic neighborhoods
- PMID: 12975345
- PMCID: PMC2172856
- DOI: 10.1083/jcb.200303131
Clustering of multiple specific genes and gene-rich R-bands around SC-35 domains: evidence for local euchromatic neighborhoods
Abstract
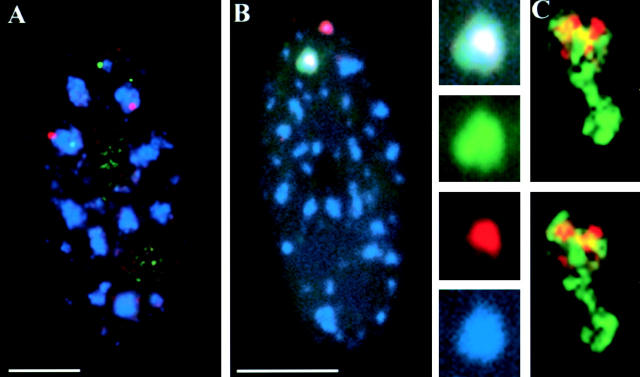
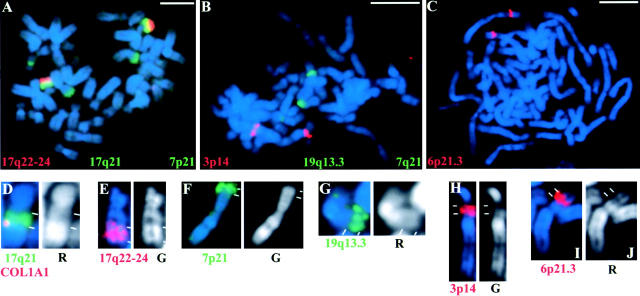
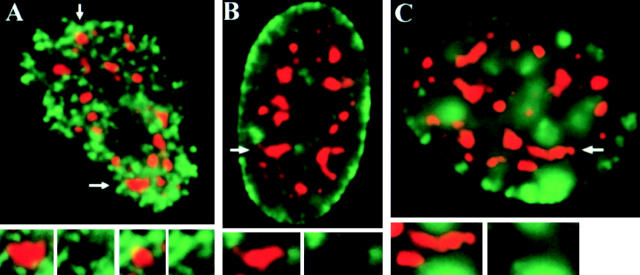
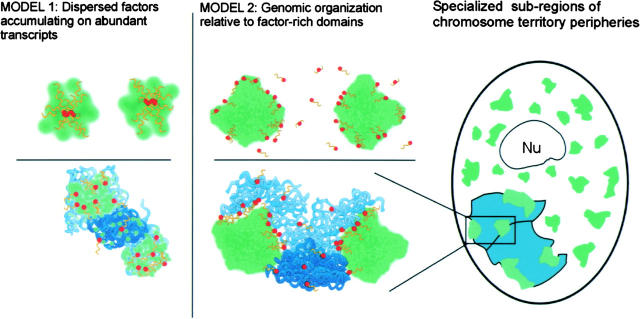
Typically, eukaryotic nuclei contain 10-30 prominent domains (referred to here as SC-35 domains) that are concentrated in mRNA metabolic factors. Here, we show that multiple specific genes cluster around a common SC-35 domain, which contains multiple mRNAs. Nonsyntenic genes are capable of associating with a common domain, but domain "choice" appears random, even for two coordinately expressed genes. Active genes widely separated on different chromosome arms associate with the same domain frequently, assorting randomly into the 3-4 subregions of the chromosome periphery that contact a domain. Most importantly, visualization of six individual chromosome bands showed that large genomic segments ( approximately 5 Mb) have striking differences in organization relative to domains. Certain bands showed extensive contact, often aligning with or encircling an SC-35 domain, whereas others did not. All three gene-rich reverse bands showed this more than the gene-poor Giemsa dark bands, and morphometric analyses demonstrated statistically significant differences. Similarly, late-replicating DNA generally avoids SC-35 domains. These findings suggest a functional rationale for gene clustering in chromosomal bands, which relates to nuclear clustering of genes with SC-35 domains. Rather than random reservoirs of splicing factors, or factors accumulated on an individual highly active gene, we propose a model of SC-35 domains as functional centers for a multitude of clustered genes, forming local euchromatic "neighborhoods."
Figures


Similar articles
-
Nonrandom gene organization: structural arrangements of specific pre-mRNA transcription and splicing with SC-35 domains.J Cell Biol. 1995 Dec;131(6 Pt 2):1635-47. doi: 10.1083/jcb.131.6.1635. J Cell Biol. 1995. PMID: 8557734 Free PMC article.
-
Processing of endogenous pre-mRNAs in association with SC-35 domains is gene specific.J Cell Biol. 1999 Feb 22;144(4):617-29. doi: 10.1083/jcb.144.4.617. J Cell Biol. 1999. PMID: 10037785 Free PMC article.
-
Chromosome territories, interchromatin domain compartment, and nuclear matrix: an integrated view of the functional nuclear architecture.Crit Rev Eukaryot Gene Expr. 2000;10(2):179-212. Crit Rev Eukaryot Gene Expr. 2000. PMID: 11186332 Review.
-
Evidence that all SC-35 domains contain mRNAs and that transcripts can be structurally constrained within these domains.J Struct Biol. 2002 Oct-Dec;140(1-3):131-9. doi: 10.1016/s1047-8477(02)00507-5. J Struct Biol. 2002. PMID: 12490161
-
[Evolution of differential chromosome banding].Genetika. 1999 Mar;35(2):277-90. Genetika. 1999. PMID: 10368780 Review. Russian.
Cited by
-
B-Myb switches from Cyclin/Cdk-dependent to Jnk- and p38 kinase-dependent phosphorylation and associates with SC35 bodies after UV stress.Cell Death Dis. 2013 Feb 28;4(2):e511. doi: 10.1038/cddis.2013.36. Cell Death Dis. 2013. PMID: 23449447 Free PMC article.
-
Spatial Organization and Dynamics of Transcription Elongation and Pre-mRNA Processing in Live Cells.Genet Res Int. 2011;2011:626081. doi: 10.4061/2011/626081. Epub 2011 Nov 24. Genet Res Int. 2011. PMID: 22567362 Free PMC article.
-
Aberrant silencing of cancer-related genes by CpG hypermethylation occurs independently of their spatial organization in the nucleus.Cancer Res. 2010 Oct 15;70(20):8015-24. doi: 10.1158/0008-5472.CAN-10-0765. Epub 2010 Aug 24. Cancer Res. 2010. PMID: 20736368 Free PMC article.
-
The X chromosome is organized into a gene-rich outer rim and an internal core containing silenced nongenic sequences.Proc Natl Acad Sci U S A. 2006 May 16;103(20):7688-93. doi: 10.1073/pnas.0601069103. Epub 2006 May 8. Proc Natl Acad Sci U S A. 2006. PMID: 16682630 Free PMC article.
-
Long-distance association of topological boundaries through nuclear condensates.Proc Natl Acad Sci U S A. 2022 Aug 9;119(32):e2206216119. doi: 10.1073/pnas.2206216119. Epub 2022 Aug 1. Proc Natl Acad Sci U S A. 2022. PMID: 35914133 Free PMC article.
References
-
- Barsh, G.S., C.L. Roush, and R.E. Gelinas. 1984. DNA and chromatin structure of the human alpha-1 (I) collagen gene. J. Biol. Chem. 259:14906–14913. - PubMed
-
- Carter, K.C., D. Bowman, W. Carrington, K. Fogarty, J.A. McNeil, F.S. Fay, and J.B. Lawrence. 1993. A three-dimensional view of precursor messenger RNA metabolism within the mammalian nucleus. Science. 259:1330–1335. - PubMed
Publication types
MeSH terms
Substances
Grants and funding
LinkOut - more resources
Full Text Sources
Miscellaneous
