. 2003 Sep 15;198(6):877-88.
doi: 10.1084/jem.20030299.

IL-1 plays an important role in lipid metabolism by regulating insulin levels under physiological conditions

Affiliations

IL-1 plays an important role in lipid metabolism by regulating insulin levels under physiological conditions

Taizo Matsuki et al. J Exp Med. .

Abstract

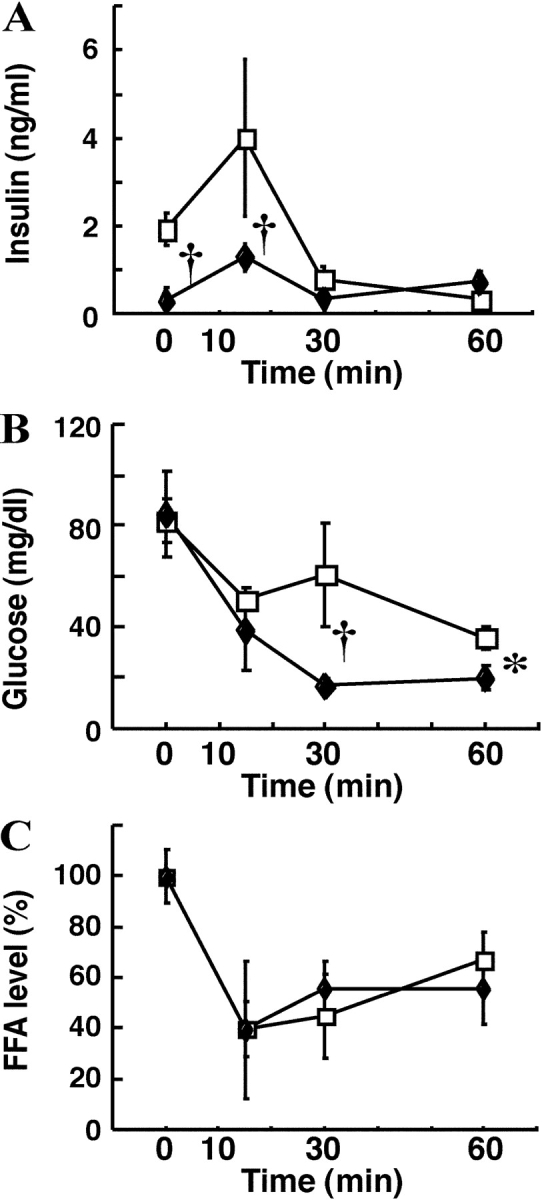
IL-1 is a proinflammatory cytokine that plays important roles in inflammation. However, the role of this cytokine under physiological conditions is not known completely. In this paper, we analyzed the role of IL-1 in maintaining body weight because IL-1 receptor antagonist-deficient (IL-1Ra-/-) mice, in which excess IL-1 signaling may be induced, show a lean phenotype. Body fat accumulation was impaired in IL-1Ra-/- mice, but feeding behavior, expression of hypothalamic factors involved in feeding control, energy expenditure, and heat production were normal. When IL-1Ra-/- mice were treated with monosodium glutamate (MSG), which causes obesity in wild-type mice by ablating cells in the hypothalamic arcuate nucleus, they were resistant to obesity, indicating that excess IL-1 signaling antagonizes the effect of MSG-sensitive neuron deficiency. IL-1Ra-/- mice showed decreased weight gain when they were fed the same amount of food as wild-type mice, and lipid accumulation remained impaired even when they were fed a high-fat diet. Interestingly, serum insulin levels and lipase activity were low in IL-1Ra-/- mice, and the insulin levels were low in contrast to wild-type mice after MSG treatment. These observations suggest that IL-1 plays an important role in lipid metabolism by regulating insulin levels and lipase activity under physiological conditions.


Figures

Figure 1.
Figure 1.
Body weight, food intake, and WAT weight in IL-1Ra−/− mice. Growth curves of male (A) and female (B) IL-1Ra−/− (closed diamonds) and wild-type mice (open squares), fed on a normal chow ad libitum. Numbers of mice used are as follows: wild-type male (n = 8) and female (n = 5); IL-1Ra−/− male (n = 11) and female (n = 5). (C) Daily food intake of male and female IL-1Ra−/− (shaded bars) and wild-type (white bars) mice that are shown in A and B. (D) Food intake per body weight and (E) WATs weight from the perireproductive tissues per body weight of IL-1Ra−/− (shaded bars) and wild-type (open bars) mice at 20 wk old. (F) Fat pads and various tissues from male IL-1Ra−/− mice (shaded bars, n = 11) fed on a normal chow were weighed at 20 wk old, and relative values to wild-type (n = 8) tissue weight are shown. (G) Paraffin sections of WAT from epididymal fat pads of 12-wk-old wild-type (+/+) and IL-1Ra−/− (−/−) mice. Hematoxylin and eosin staining. ×200. Data are expressed as the average ± SD. Epi, epididymal; Ing, inguinal; Ret, retroperitoneal; Ad. peri-adrenal; Inter, interscapular-WAT or BAT. Statistical significance was calculated by repeated measures ANOVAs and Tukey post hoc tests (A–C), and by Student's t tests (D–F). *, P < 0.05, , P < 0.01 versus wild-type mice.
Figure 2.
Figure 2.
Normal expression of hypothalamic peptides and adipo-cytokines after fasting in IL-1Ra−/− mice. (A) 5 μg poly (A)+RNAs from the hypothalamus of fed or fasted mice (four mice for each lane) were purified, and Northern blot hybridization was performed with indicated probes. (B) 20 μg total RNAs from epididymal WAT were prepared, and hybridized with indicated probes. F, fed ad libitum (white bars), A, fasted for 48 h (shaded bars). +/+, wild-type mice, −/−, IL-1Ra−/− mice. Autoradiographs are representative in three independent experiments using at least four animals in one group. Data are expressed as the average ± SD of all the experiments.
Figure 3.
Figure 3.
Impairment of energy storage in IL-1Ra−/− mice. Body weight changes of age-matched wild-type (open squares, n = 5) and IL-1Ra−/− (closed diamonds, n = 5) male mice under food restriction (0.9 g/day of a normal chow). Data are expressed as the average ± SD. , P < 0.01 versus wild-type mice
Figure 4.
Figure 4.
Impairment of lipid accumulation into WATs in IL-1Ra−/− mice. Mice were fed with a normal chow (Normal) or a high-fat diet (HF diet) for 8 wk. Body weight (A), epididymal WAT mass (B), and serum TAG level (C) were compared between normal chow and high-fat diet groups. IL-1Ra−/− (shaded bars, n = 5) and wild-type (white bars, n = 5) mice at the age of 17 wk were used. Data are expressed as the average ± SD. Statistical significance was determined by one-way ANOVAs and Fischer's PLSDs. *, P < 0.05, , P < 0.01 versus wild-type mice fed with the same chow. , P < 0.01 versus the same genotype mice fed with a normal chow.
Figure 5.
Figure 5.
Decreased serum levels of insulin, TAG, and leptin in IL-1Ra−/− mice. Blood glucose (A), serum insulin (B), TAG (C), and leptin (D) levels in body weight matched wild-type (8 wk old, white bars) and IL-1Ra−/− (15 wk old, shaded bars) mice were measured. “Fed” samples were collected from mice fed ad libitum 2 d before fasting. “Fasted” samples were collected after 48 h of fasting, and refeeding started (0 h). Data are expressed as the average ± SD, and are reproducible for three independent experiments using at least four mice in each genotype. Statistical significance was determined by Student's t tests. *, P < 0.05, , P < 0.01 versus wild-type mice.
Figure 6.
Figure 6.
Reduction of insulin levels in IL-1Ra−/− mice. Insulin levels after glucose tolerance test (A), and glucose (B) and FFA (C) levels after insulin tolerance test in wild-type (open squares) and IL-1Ra−/− (closed diamonds) mice. Relative FFA levels are expressed as the percentage relative to the value at time 0 (before insulin administration). Data are expressed as the average ± SD. The results are reproducible in three independent experiments using at least four mice for each genotype. Statistical significance was determined by Student's t tests. *, P < 0.05, , P < 0.01 versus wild-type mice.
Figure 7.
Figure 7.
Resistance of IL-1Ra−/− mice to MSG-induced obesity. Total body weights of male (A) and female (B) control (wild-type and IL-1Ra+/−) mice (squares) and IL-1Ra−/− mice (diamonds) after MSG (closed symbols) or saline (open symbols) treatment were measured (MSG-treated control mice: male, n = 6, female, n = 8; saline-treated control mice: male, n = 13, female, n = 10; MSG-treated IL-1Ra−/− mice: male, n = 9, female, n = 5; saline-treated IL-1Ra−/− mice: male, n = 13, female, n = 5). Serum insulin levels (C) and WAT weight from epididymis (D) of male control mice and IL-1Ra−/− mice at 20 wk old after MSG (shaded bars) or saline (white bars) treatment. Data are expressed as the average ± SD. Statistical significance was calculated by repeated measures ANOVAs and Tukey post hoc tests. *, P < 0.05 MSG-treated IL-1Ra−/− mice versus MSG-treated wild-type mice. , P < 0.05 MSG-treated versus saline-treated mice.
Figure 8.
Figure 8.
Reduced PHP lipase activity in IL-1Ra−/− mice. Mice were administered 100 U/kg heparin intravenously, and plasma were collected after 5 min (A) total lipase activity and (B) hepatic lipase activity of the PHP from age-matched wild-type (white bars, n = 8) and IL-1Ra−/− (shaded bars, n = 5) male mice. Data are expressed as the average ± SD. Statistical significance was determined by Student's t tests. *, P < 0.05 versus wild-type mice.

References

    1. Dinarello, C.A. 1991. Interleukin-1 and interleukin-1 antagonism. Blood. 77:1627–1652. - PubMed
    1. Dinarello, C.A. 1996. Biologic basis for interleukin-1 in disease. Blood. 87:2095–2147. - PubMed
    1. Dinarello, C.A. 1998. Interleukin-1, interleukin-1 receptors and interleukin-1 receptor antagonist. Int. Rev. Immunol. 16:457–499. - PubMed
    1. Tocci, M.J., and J.A. Schmidt. 1997. Interleukin-1: Structure and function. Cytokines in health and disease, second edition. D.G. Remick and J.S. Friedland, editors. Marcel Dekker, Inc., New York.1–27.
    1. Horai, R., M. Asano, K. Sudo, H. Kanuka, M. Suzuki, M. Nishihara, M. Takahashi, and Y. Iwakura. 1998. Production of mice deficient in genes for interleukin (IL)-1α, IL-1β, IL-1α/β, and IL-1 receptor antagonist shows that IL-1β is crucial in turpentine-induced fever development and glucocorticoid secretion. J. Exp. Med. 187:1463–1475. - PMC - PubMed

Publication types

MeSH terms