. 2003 Sep;112(6):872-82.
doi: 10.1172/JCI19112.

CD69 downregulates autoimmune reactivity through active transforming growth factor-beta production in collagen-induced arthritis

Affiliations

CD69 downregulates autoimmune reactivity through active transforming growth factor-beta production in collagen-induced arthritis

David Sancho et al. J Clin Invest. 2003 Sep.

Abstract

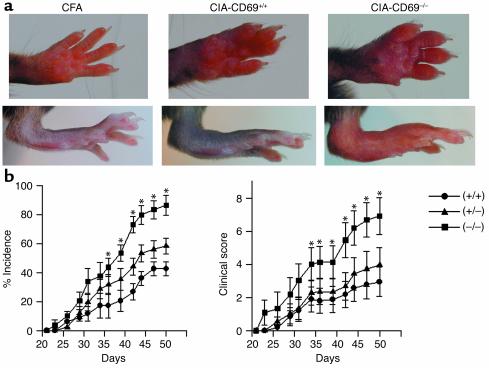
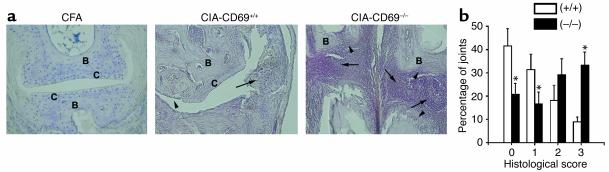
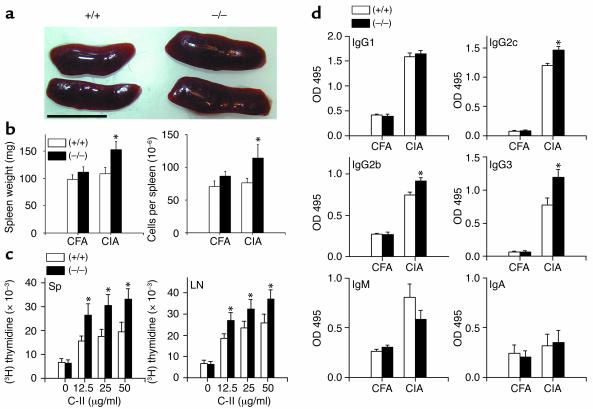
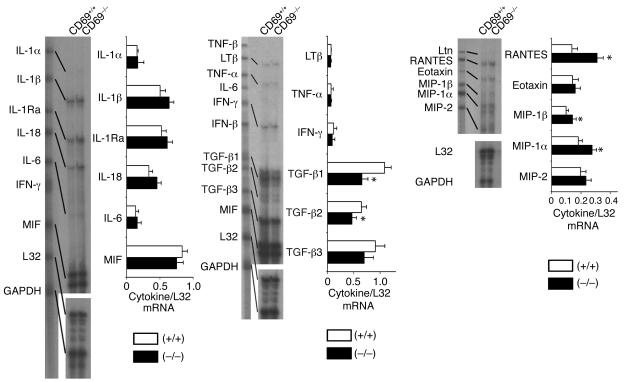
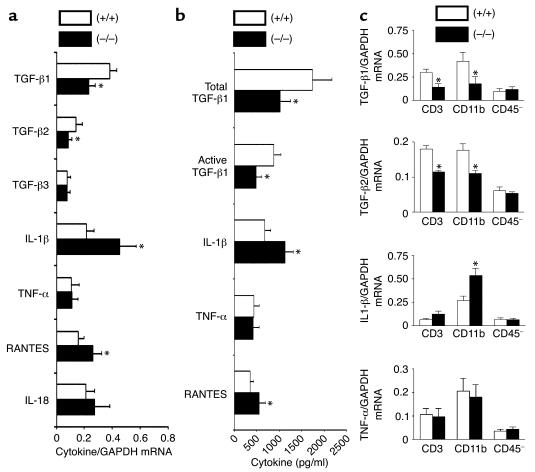
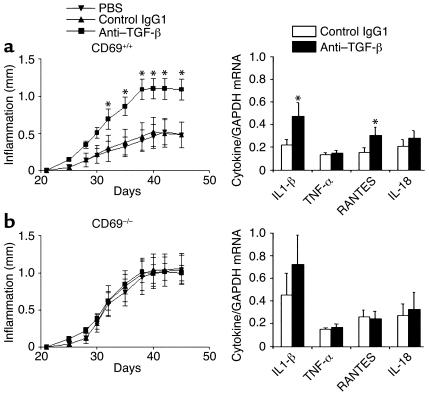
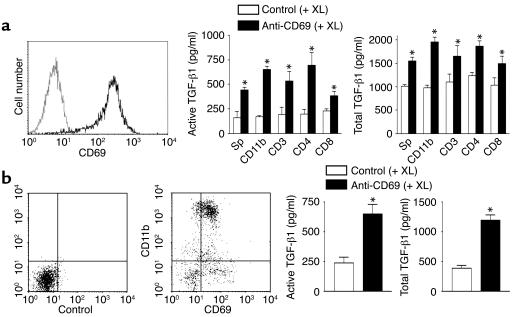
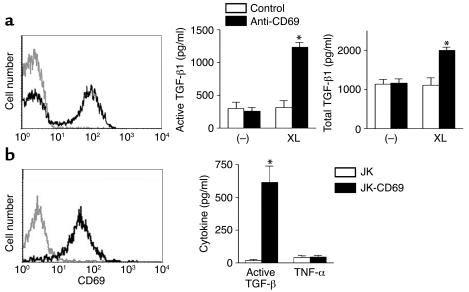
CD69 is induced after activation of leukocytes at inflammatory sites, but its physiological role during inflammation remains unknown. We explored the role of CD69 in autoimmune reactivity by analyzing a model of collagen-induced arthritis (CIA) in WT and CD69-deficient mice. CD69-/- mice showed higher incidence and severity of CIA, with exacerbated T and B cell immune responses to type II collagen. Levels of TGF-beta1 and TGF-beta2, which act as protective agents in CIA, were reduced in CD69-/- mice inflammatory foci, correlating with the increase in the proinflammatory cytokines IL-1beta and RANTES. Local injection of blocking anti-TGF-beta antibodies increased CIA severity and proinflammatory cytokine mRNA levels in CD69+/+ but not in CD69-/- mice. Moreover, in vitro engagement of CD69 induced total and active TGF-beta1 production in Concanavalin A-activated splenocyte subsets, mouse and human synovial leukocytes, and Jurkat stable transfectants of human CD69 but not in the parental CD69 negative cell line. Our results show that CD69 is a negative modulator of autoimmune reactivity and inflammation through the synthesis of TGF-beta, a cytokine that in turn downregulates the production of various proinflammatory mediators.


Figures

Figure 1
Figure 1
Exacerbated CIA in CD69–/– mice. (a) CFA-treated control mice (left panels) are compared with representative pictures of the most severe cases of CIA in CD69+/+ mice and CD69–/–mice (middle and right panels, respectively). (b) Incidence of arthritis (percentage of diseased mice) and severity of clinical signs in CD69+/+ (circles), CD69+/– (triangles), and CD69–/– (squares) mice evaluated as described in Methods. Results correspond to the arithmetic mean ± SD from three separate experiments (18 mice per group per experiment). *P < 0.01 versus CD69+/+ (Student’s t test).
Figure 2
Figure 2
Histological assessment of CIA in CD69-deficient mice. (a) Representative section of joint histopathology on whole paws of control (CFA, left panel, ×100) and CII-immunized CD69+/+ (middle panel, ×100) and CD69–/– (right panel, ×60) mice. Arrowheads indicate cartilage and bone erosions, and arrows indicate leukocyte infiltrates and pannus. C, cartilage; B, bone. (b) Scoring of inflammation, cartilage damage, pannus formation, and bone erosion of paws from CD69+/+ (white bars) and CD69–/– (black bars) mice as described in Methods. Results are expressed as the arithmetic mean ± SD of the percentage of joints ascribed to each severity group from three independent experiments (eight mice per group per experiment); *P < 0.01 versus CD69+/+ (Mann-Whitney U test).
Figure 3
Figure 3
Enhanced CII-specific immune response in CD69–/– mice. (a) Enlarged spleens of CD69–/– compared with CD69+/+ mice. Scale bar: 1 cm. (b) Spleen weight and cell number (arithmetic mean ± SD) from CFA control and CII-immunized (CIA) CD69+/+ (white bars) and CD69–/– (black bars) mice are shown. *P < 0.01 versus WT immunized mice (Student’s t test). (c) Proliferation of spleen and LN cells from CII-immunized CD69+/+ (white bars) and CD69–/– (black bars) mice stimulated with different concentrations of inactivated CII (x axis). Data correspond to the arithmetic mean ± SD of [3H]TdR uptake in three independent experiments. *P < 0.01 versus CD69+/+ (Mann-Whitney U test). Sp, spleen. (d) Increments of CII-specific Th1-dependent isotypes in CD69–/– mice. CII-specific IgG1 and IgG2b (1:20,000 serum dilution), IgG2c and IgG3 (1:5,000 serum dilution), and IgM and IgA (1:200 serum dilution) antibody levels in sera collected at sacrifice (day 50) of CFA-treated control or CII-immunized (CIA) CD69+/+ (white bars) and CD69–/– (black bars) mice. Data are represented as the arithmetic mean ± SD of absorbance units at 495 nm in three separate experiments (10 mice per group per experiment). *P < 0.01 versus CD69+/+ (Student’s t test).
Figure 4
Figure 4
Local cytokine mRNA analysis in CII-immunized CD69–/– mice. mRNA analysis of CIA CD69+/+ (white bars) and CD69–/– (black bars) mouse hind paws. Each lane corresponds to the mRNA pool of six mice per group, and each bar represents similar experiments (six mice per group per experiment). Results are expressed in arbitrary densitometric units normalized for expression of the ribosomal housekeeping protein L32 in each sample (arithmetic mean ± SD of four separate experiments). *P < 0.01 versus CD69+/+ (Mann-Whitney U test). MIF, macrophage inhibitory factor; LTβ, lymphotoxin-β; Ltn, lymphotoxin.
Figure 5
Figure 5
Local cytokine analysis in joints and purified leukocyte synovial cells from CII-immunized CD69–/– mice. (a) Real-time quantitative RT-PCR analysis of mRNA from CD69+/+ (white bars) and CD69–/– (black bars) mouse hind paws. Each bar represents the arithmetic mean ± SD of 12 mice per group in two independent experiments. Results for each cytokine are normalized to GAPDH expression measured in parallel in each sample. *P < 0.01 versus CD69+/+ (Mann-Whitney U test). (b) Levels of active and total TGF-β1, IL-1β, TNF-α, and RANTES in synovial washouts from CIA CD69+/+ (white bars) and CD69–/– (black bars) mice. Data correspond to the arithmetic mean ± SD of three independent experiments (six mice per group per experiment). *P < 0.01 versus CD69+/+ (Mann-Whitney U test). (c) Quantitative RT-PCR analysis of mRNA from CD69+/+ (white bars) and CD69–/– (black bars) purified subsets of synovial cells. Each histogram represents the arithmetic mean ± SD of 12 mice per group in two independent experiments. Results of each cytokine are normalized to GAPDH expression measured in parallel in each sample. *P < 0.01 versus CD69+/+ (Mann-Whitney U test).
Figure 6
Figure 6
Effect of a blocking anti–TGF-β antibody in WT and CD69-deficient mice. (a) As shown in the left panel, CD69+/+ mice were treated from day 21 (second immunization) with the blocking anti–TGF-β antibody (squares), the isotype control IgG1 (triangles), or the carrier (inverted triangles). Paw inflammation measured with a precision caliper is expressed in millimeters of inflammation with respect to day 21. Results express the arithmetic mean ± SD of 12 mice per group in two independent experiments. On the right, analysis by quantitative real-time RT-PCR of mRNA from paws treated with isotype control antibody (white bars) or with anti–TGF-β (black bars) is shown. Each bar represents the arithmetic mean ± SD of 12 mice per group in two independent experiments. Results of each cytokine are normalized to GAPDH expression measured in parallel in each sample. *P < 0.01 versus control antibody (Mann-Whitney U test). (b) CD69–/– mice were treated as in a, paw inflammation was measured (left panel), and mRNA was determined (right panel) as above.
Figure 7
Figure 7
CD69 engagement induces TGF-β1 secretion in mouse splenocytes and synovial leukocytes from CIA mice. (a) ConA-stimulated splenocytes were stained for CD69 (solid line, left panel) and an isotype-matched antibody (dotted line, left panel). Activated splenocytes were then purified in different subsets and treated with an anti-mouse CD69 (black bars) or an isotype-matched control antibody (white bars), and a cross-linking secondary antibody was added. Active and total TGF-β1 were determined (right panel). (b) Mouse synovial cells from CIA mice were stained for CD11b and CD69 (middle panel) or isotype control antibodies (left panel). Synovial cells were treated as in a, and active and total TGF-β1 was determined (right panel). Results in a and b are expressed as the arithmetic mean ± SD of four independent experiments. *P < 0.01 versus control antibody (Mann-Whitney U test). XL, cross-linker.
Figure 8
Figure 8
CD69 cross-linking induces TGF-β1 production in human synovial leukocytes and in a human CD69 T cell stable transfectant. (a) Human synovial leukocytes from patients with RA were stained for CD69 (solid line, left panel) and isotype-matched antibody (dotted line, left panel). Synovial leukocytes were treated with anti-human CD69 (black bars) or an isotype-matched control antibody (white bars) in the presence (XL) or absence (–) of a cross-linking secondary antibody, and active and total TGF-β1 were determined (right). *P < 0.01 versus control antibody (Mann-Whitney U test). These results are representative of similar data obtained on synovial leukocytes from patients with reactive arthritis or ankylosing spondylitis. (b) Jurkat human T cell leukemic cell line (dotted line, left panel) and CD69 stable transfectants (solid line, left panel) were stained for CD69. Production of TGF-β1 but not TNF-α by CD69 engagement is shown in the right panel. The human T lymphoblastoid cell line Jurkat (JK) (white bars) and the stable transfectant expressing CD69 (JK-CD69) (black bars) were treated for 24 hours with cross-linked anti-CD69. Results in a and b are expressed as the arithmetic mean ± SD of four independent experiments. *P < 0.01 versus the parental JK cell line (Mann Whitney U test).

Similar articles

Cited by

References

    1. Hara T, Jung LK, Bjorndahl JM, Fu SM. Human T cell activation. III. Rapid induction of a phosphorylated 28 kD/32 kD disulfide-linked early activation antigen (EA 1) by 12-o-tetradecanoyl phorbol-13-acetate, mitogens, and antigens. J. Exp. Med. 1986;164:1988–2005. - PMC - PubMed
    1. Cosulich ME, Rubartelli A, Risso A, Cozzolino F, Bargellesi A. Functional characterization of an antigen involved in an early step of T-cell activation. Proc. Natl. Acad. Sci. U. S. A. 1987;84:4205–4209. - PMC - PubMed
    1. Cebrian M, et al. Triggering of T cell proliferation through AIM, an activation inducer molecule expressed on activated human lymphocytes. J. Exp. Med. 1988;168:1621–1637. - PMC - PubMed
    1. Testi R, D’Ambrosio D, De Maria R, Santoni A. The CD69 receptor: a multipurpose cell-surface trigger for hematopoietic cells. Immunol. Today. 1994;15:479–483. - PubMed
    1. Sancho D, Yanez-Mo M, Tejedor R, Sanchez-Madrid F. Activation of peripheral blood T cells by interaction and migration through endothelium: role of lymphocyte function antigen- 1/intercellular adhesion molecule-1 and interleukin-15. Blood. 1999;93:886–896. - PubMed

Publication types

MeSH terms