

Subpopulations of long-lived and short-lived T cells in advanced HIV-1 infection
- PMID: 12975480
- PMCID: PMC193663
- DOI: 10.1172/JCI17533
Subpopulations of long-lived and short-lived T cells in advanced HIV-1 infection
Abstract
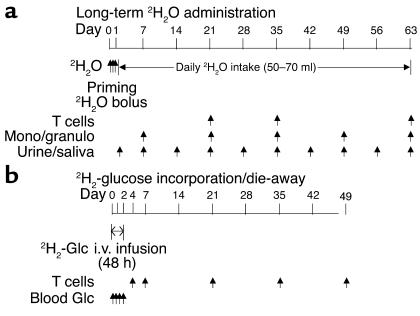
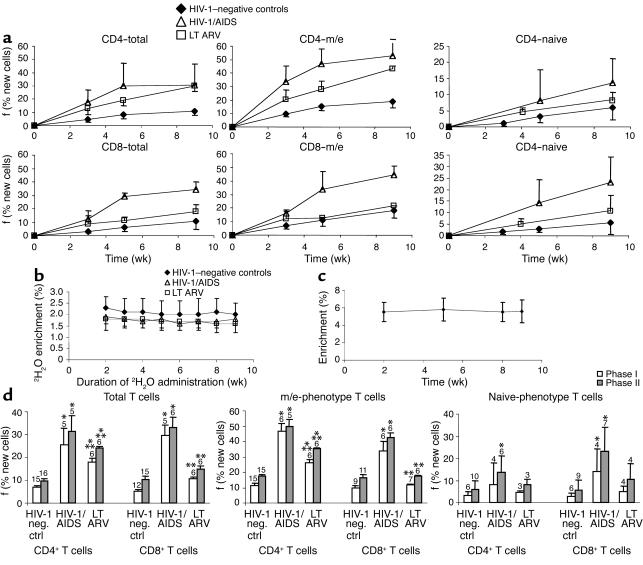
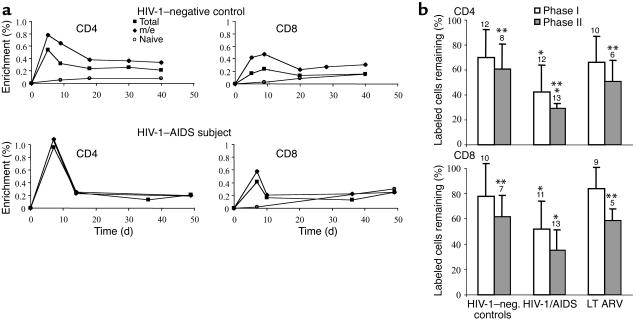
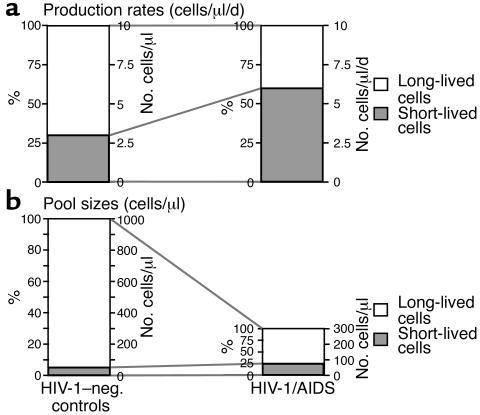
Antigenic stimulation of T cells gives rise to short-lived effector cells and long-lived memory cells. We used two stable isotope-labeling techniques to identify kinetically distinct subpopulations of T cells and to determine the effect of advanced infection with HIV-1. Long-term deuterated water (2H2O) incorporation into DNA demonstrated biphasic accrual of total and of memory/effector (m/e)-phenotype but not naive-phenotype T cells, consistent with the presence of short-lived and longer-lived subpopulations within the m/e-phenotype T cell pool. These results were mirrored by biphasic die-away kinetics in m/e- but not naive-phenotype T cells after short-term 2H-glucose labeling. Persistent label retention was observed in a subset of m/e-phenotype T cells (presumably memory T cells), confirming the presence of T cells with very different life spans in humans. In advanced HIV-1 infection, much higher proportions of T cells were short-lived, compared to healthy controls. Effective long-term anti-retroviral therapy restored values to normal. These results provide the first quantitative evidence that long-lived and quiescent T cells do indeed predominate in the T cell pool in humans and determine T cell pool size, as in rodents. The greatest impact of advanced HIV-1 infection is to reduce the generation of long-lived, potential progenitor T cells.
Figures
Comment in
-
Turnover of lymphocytes and conceptual paradigms in HIV infection.J Clin Invest. 2003 Sep;112(6):821-4. doi: 10.1172/JCI19799. J Clin Invest. 2003. PMID: 12975464 Free PMC article.
References
-
- Ahmed R, Gray D. Immunological memory and protective immunity: understanding their relation. Science. 1996;272:54–60. - PubMed
-
- Rocha B, Freitas AA, Coutinho AA. Population dynamics of T lymphocytes. Renewal rate and expansion in the peripheral lymphoid organs. J. Immunol. 1983;131:2158–2164. - PubMed
-
- Sallusto F, Lenig D, Forster R, Lipp M, Lanzavecchia A. Two subsets of memory T lymphocytes with distinct homing potentials and effector functions. Nature. 1999;401:708–712. - PubMed
-
- Mackay CR. Dual personality of memory T-cells. Nature. 1999;401:659–660. - PubMed
-
- Jacob J, Baltimore D. Modeling T-cell memory by genetic marking of memory T-cells in vivo. Nature. 1999;399:593–597. - PubMed
Publication types
MeSH terms
Substances
Grants and funding
- R01 AI041401/AI/NIAID NIH HHS/United States
- AI43866/AI/NIAID NIH HHS/United States
- AI40312/AI/NIAID NIH HHS/United States
- M01-RR00083/RR/NCRR NIH HHS/United States
- R37 AI043866/AI/NIAID NIH HHS/United States
- R01 AI043866/AI/NIAID NIH HHS/United States
- AI41401/AI/NIAID NIH HHS/United States
- R37 AI040312/AI/NIAID NIH HHS/United States
- R01 AI040312/AI/NIAID NIH HHS/United States
- AI43864/AI/NIAID NIH HHS/United States
- M01 RR000083/RR/NCRR NIH HHS/United States
- U01 AI043864/AI/NIAID NIH HHS/United States
- AI44767/AI/NIAID NIH HHS/United States
- R01 AI043864/AI/NIAID NIH HHS/United States
LinkOut - more resources
Full Text Sources
Other Literature Sources
Medical
