

doi: 10.1155/S1110724303209165.
Practical Modeling Concepts for Connective Tissue Stem Cell and Progenitor Compartment Kinetics
- PMID: 12975533
- PMCID: PMC400211
- DOI: 10.1155/S1110724303209165
Item in Clipboard
Practical Modeling Concepts for Connective Tissue Stem Cell and Progenitor Compartment Kinetics
J Biomed Biotechnol.
2003.
Abstract
Stem cell activation and development is central to skeletal development, maintenance, and repair, as it is for all tissues. However, an integrated model of stem cell proliferation, differentiation, and transit between functional compartments has yet to evolve. In this paper, the authors review current concepts in stem cell biology and progenitor cell growth and differentiation kinetics in the context of bone formation. A cell-based modeling strategy is developed and offered as a tool for conceptual and quantitative exploration of the key kinetic variables and possible organizational hierarchies in bone tissue development and remodeling, as well as in tissue engineering strategies for bone repair.
Figures
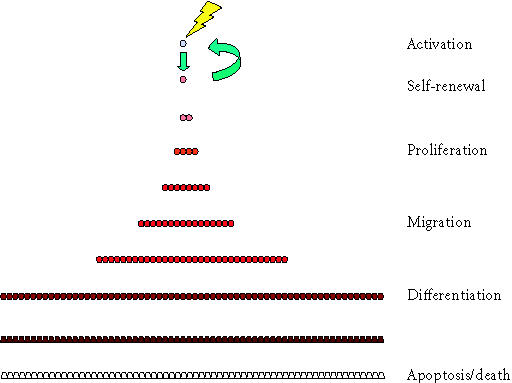
Six stages in the stem cell life cycle. In the simplest scenario, the life cycle of cells in a stem cell system involves at least six stages. This begins with the cycle of stem cell activation and cell division producing a progenitor cell and self-renewal of the stem cell, but is continuous with the process of proliferation of progenitors, migration, differentiation, and eventual apoptosis or cell death.
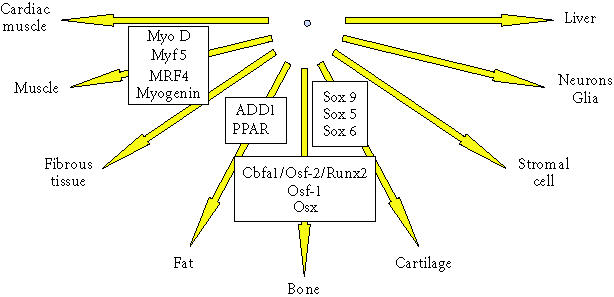
Differentiation pathways for connective tissue progenitors. This diagram illustrates the potential differentiation pathways available to connective tissue progenitor cells. Some of the transcription factors that regulate these pathways are shown in associated boxes.
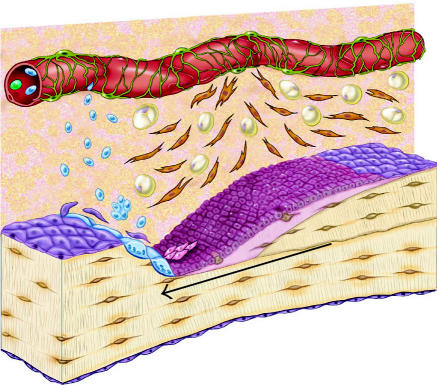
Schematic diagram of the osteoblastic stem cell system. This conceptual drawing illustrates the primary candidate populations of stem cells and transit cells thought to be associated with bone formation and remodeling. Vascular pericytes (green), Westen-Bainton cells (orange), type I or pre-osteoblasts (pink), secretory osteoblasts (maroon), osteocytes (brown), lining cells (purple), and adipocytes (yellow). Vascular pericytes may give rise to the Westen-Bainton cells. Pericytes and Westen-Bainton cells may contribute to the formation of pre-osteoblasts and also adipocytes. New osteoblast are added in the region immediately behind the advancing front of osteoclastic resorption. Secretory osteoblasts produce new bone matrix until they become quiescent on the surface of bone as a lining cells (purple) or become embedded in the matrix as osteocytes (brown), or die via apoptosis. Osteoclast formation is also illustrated. A fraction of the monocytes population in systemic circulation (blue) will become resident in the bone marrow space. Osteoclasts are formed by fusion of monocytes resident in bone marrow to form multinucleated functional units. The nuclei in active osteoclasts continue to be turned over as a result of nuclear loss and ongoing fusion events with new marrow-derived monocytes [103]. The black arrow indicates the direction of bone resorption by the osteoclastic front, followed by bone formation.
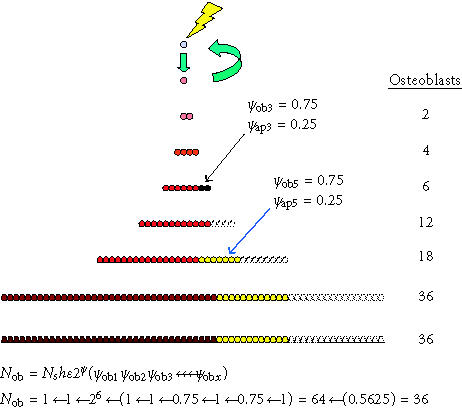
Competing differentiation options and events. The effect of alternative commitment events on the number of mature osteoblasts produced after the activation of one connective tissue stem cell is shown. In this example, the probability of retaining an osteoblastic phenotype (ρob) was 1 after all mitotic events, with the exception of the third and fifth symmetric mitosis. After the third mitosis, 25% of the cells undergo apoptosis (ρob 3 = 0.75). As a result, 16
fewer cells are produced. After the fifth mitosis, 25% of the cells commit to adipocytic differentiation (ρob 5 = 0.75). Twelve adipocytes are the result. These events leave an overall probability of osteoblastic differentiation (Pob) among the possible progeny of 0.5625 (0.75 × 0.75). The
result is an approximately 44% reduction in the total number of osteoblasts produced, from 64 to 36. Even if these progenitors continue to proliferate for many more cell divisions before differentiating without further commitment to nonosteoblastic
phenotypes, these two events related to the third and fifth mitosis effectively limit the number of mature osteoblasts to only 56% of the theoretical maximum.
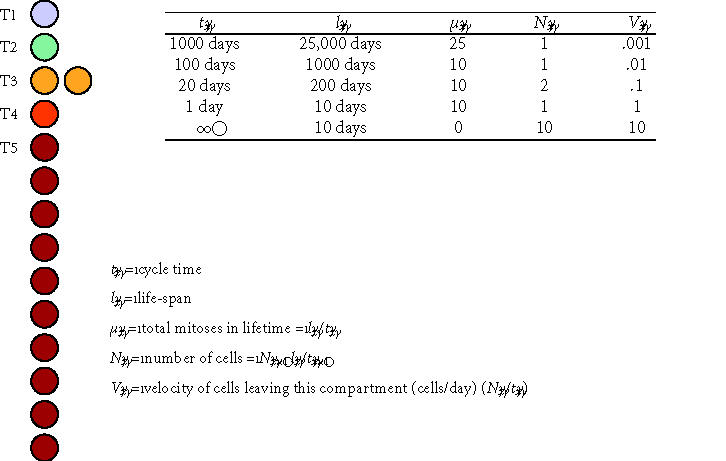
Conceptual model of transit cell amplification. This schematic diagram and associated table illustrate several central concepts in the proliferating transit cell paradigm. A stem cell (T1) and three proliferating transit cell populations (T2, T3, and T4) are modeled at steady state in a contiguous linear array supporting a population of mature cells (M/T5). All cell division is modeled as asymmetric events associated with renewal of the founding cell. The table illustrates hypothetical values for the cycle time (tx), life-span for cells in each compartment (lx), the effective mean number of cell divisions in each compartment (μx), the resulting number of cells resident in each transit compartment (Nx), and a velocity or rate at which cells leave each compartment (Vx). In this model, the originating stem cell survives throughout the life of the individual (l1 = 25,000 days ∼ 68 years), cycling as a slow rate of one cell division every 1000 days (t1 = 1000 days). During the life of the stem cell, it divides a total of 25 times (μ1 = 25). The velocity of cells leaving the stem cell compartment and entering the T2 compartment is 1 cell per 1000 days, or V1 = 0.001 cells/day. Cells in the T2 compartment function similarly to feed the T3 compartment, and so on. Cells in downstream populations (T2, T3, and T4) divide more rapidly than cells in upstream compartments. In contrast to the
originating stem cells, the cells in downstream compartments also have limited self-renewal capacity, resulting in decreasing functional life-span for cells in each compartment. Note that, in the absence of any transit populations, the upstream stem cell would need to divide 25,000 times to generate the same number of mature cells over the life of the individual.
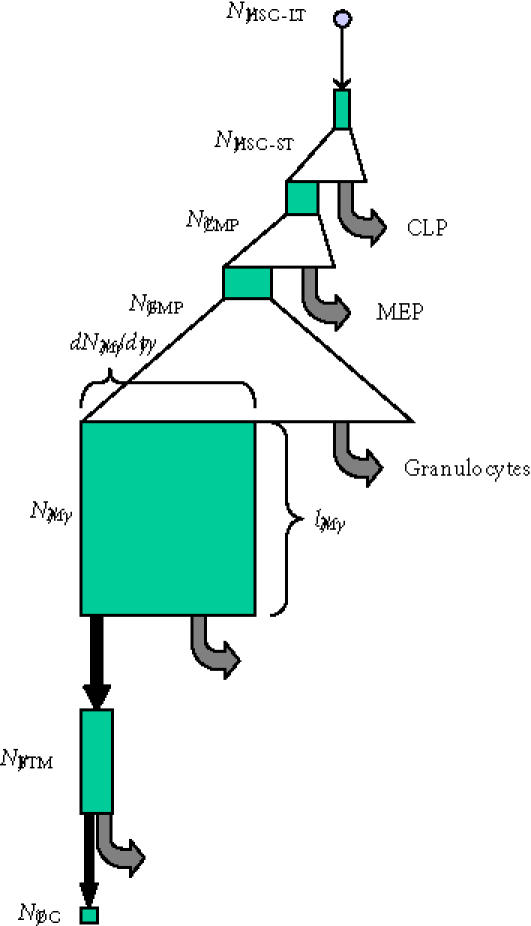
Transit cell populations in osteoclast formation. The conceptual hierarchy
of transit cell populations upstream of the osteoclast is illustrated. Triangles indicate phases of clonal expansion arising from proliferating transit populations. Black arrows indicate transit events in which cells move from one compartment to another associated with changes in their intrinsic biological properties. Grey arrows indicate departure of cells from the upstream compartment to other cell compartments. Green boxes illustrate the conceptual size of each cell population, where the width of the box represents the rate at which cells are added to or leave each compartment at steady state, and the height of each box represents the mean life-span or residence time of cells within each compartment. (Abbreviations: HSC-LT, long-term repopulating hematopoietic stem cell; HSC-ST, short-term repopulating hematopoietic stem cell; CMP, common myeloid progenitor; CLP, common lymphoid progenitor; MEP, megakaryocyte erythroid progenitor; GMP, myelomonocytic progenitor; M, monocyte; BMT, bone tissue monocyte; OC, osteoclast nuclei [114].)
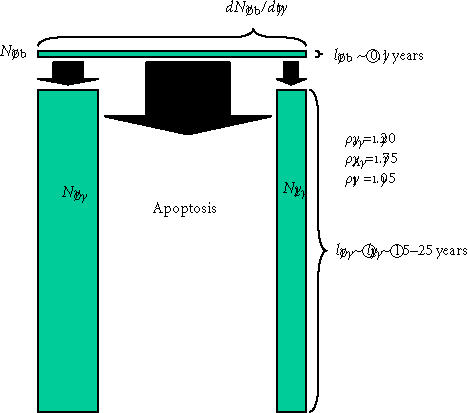
Transit cell populations downstream of the osteoblast. The three differentiation pathways available to osteoblasts and the two transit populations downstream of the osteoblast are illustrated, using the same illustration strategy described in Figure 6. Probability values that would be common in cortical osteonal bone remodeling are illustrated.
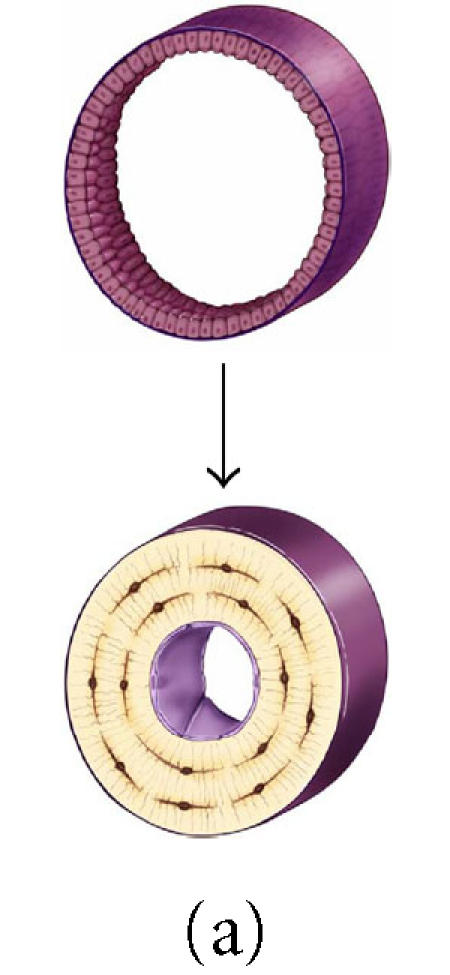
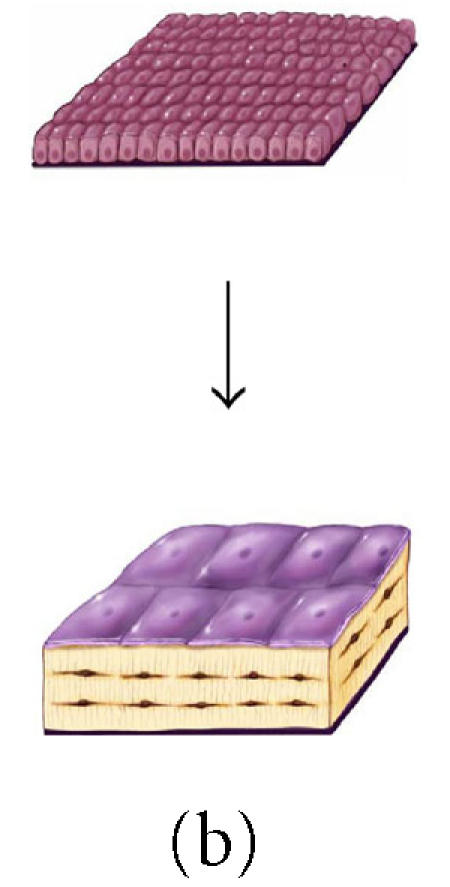
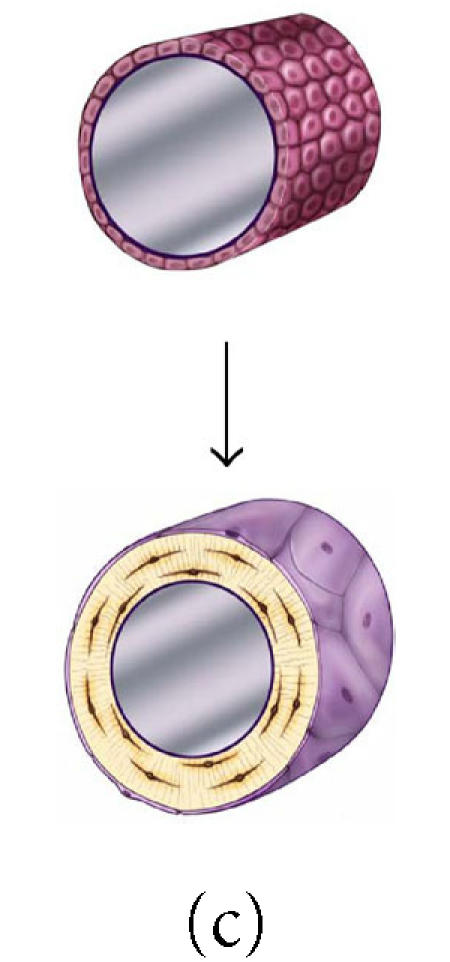
The effect of surface geometry on the fate of 128 osteoblasts. A cell-based model is shown representing bone formation on three different surface geometries: (a) a concave segment of a 200 μm diameter osteon in cortical bone, (b) a flat surface in cortical or cancellous bone, and (c) the convex surface of a 100 μm diameter trabecula in cancellous bone. In each case, a set of 128 osteoblasts is shown at t =0 as ∼ 12.5 μ cuboidal cells covering an
appropriate segment of the bone surface. Below, the same surface and the new bone formed by this set of 128 osteoblasts are shown. In each case, some fraction of cells must become embedded in the matrix as osteocytes to maintain an appropriate osteocyte density and some osteoblasts must be retained as lining cells covering the remaining surface. Cells that are not required as osteocytes or lining cells are presumed to be lost through apoptosis. The probability of osteoblast transit into the osteocyte or lining cell population, and the probability of apoptosis are dependent on surface geometry, the density of osteocytes in the matrix, and the thickness of the new bone that is formed at the site.
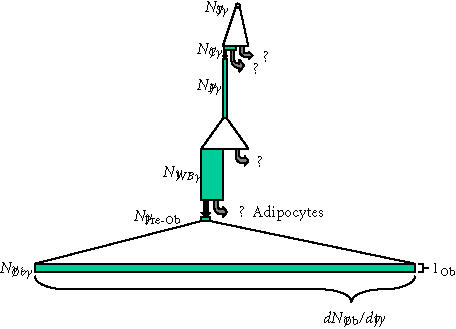
Transit cell populations upstream of osteoblasts. The putative transit cell populations that are upstream of the osteoblast are shown, using the same illustration strategy described in Figures 6 and 7. The upstream originating stem cell, the pericyte, and the pre-osteoblast (type I osteoblast) are all presumed to be proliferating transit populations. Precise features of this diagram (the magnitude of expansion, the life-span, the rate of transit, and even pathways of transit
between these potential populations) must be considered highly speculative, though it is consistent with available data and prevailing theory. Regardless of this speculation, it is useful to compare this diagram to that illustrating the events that occur downstream of the osteoblast shown in Figure 7. This comparison illustrates the very small rate of cell division and small rate of transit that must be expected in transit populations upstream of the osteoblast, relative to downstream events. Similarly, it also illustrates that one or more of these upstream populations (eg, the Westin-Bainton cell) might be present in comparable numbers to the active osteoblast population, if the life-span of cells in these transit compartments significantly greater that was the life-span of the secretory osteoblast. (Abbreviations: S, upstream stem cell; C, circulating stem cell; P, vascular pericytes; WB, Westen-Bainton Cells; Pre-Ob, Pre-osteoblast (Type I osteoblast); Ob, mature secretory osteoblast.)
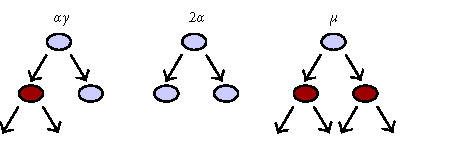
Three options for stem cell division. Three possible outcomes of stem cell activation and cell division are illustrated: an “α” division represents the classic asymmetric cell division with renewal of the mother cell and generation of a daughter that enters a downstream transit population. A “2α” cell division generates two identical stem cells, increasing the number of total stem cells by one. Finally, a “μ” division generates two cells that enter a downstream transit population, depleting the number of stem cells by one. The balance between “2α” and “μ” events determines whether a given stem cell pool will increase or decrease in number.
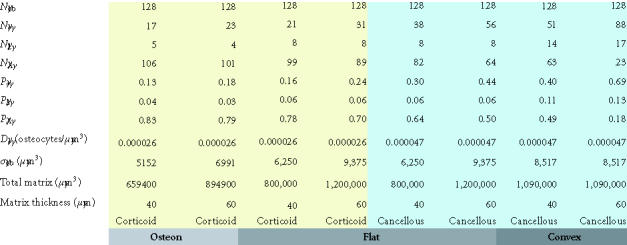
The effect of osteocyte density and surface geometry on osteoblast fate and function. This table provides a quantitative assessment of the end result in each geometric configuration illustrated in Figures 8a, 8b, and 8c. Each geometry calculations are based on formation of 40 μm or 60 μm thick volume new bone. The table illustrates the fate of the initial set of 128 osteoblasts, identifying the number of osteocytes (No) and lining cells (NL) that are required and the probability of an initial osteoblast form an osteocyte (ρo), a lining cell (ρl), or to undergo apoptisis (ρA). Calculations for cortical and trabecular cancellous bone differ based on published values for osteocyte density in cortical and trabecular bone. Note that the required probability for osteocyte formation (ρo) increases dramatically in these examples from 0.13 to 0.69 as the surface geometry changes from concave to convex, as the osteocyte density changes from cortical to cancellous bone, and as the thickness of new bone increases.
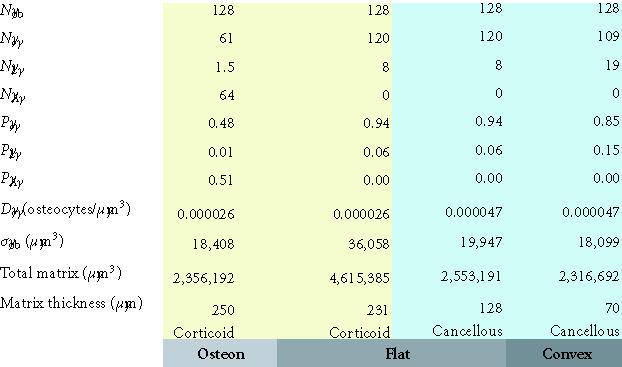
Maximum matrix thickness of new bone formation on a concave, flat, or convex surface. This table illustrates the maximum theoretical thickness of new bone
formation for the 128 cells illustrated in each geometric configuration shown in Figures 8a, 8b, and 8c. For flat and convex surfaces, the limit occurs when osteoblasts become osteocytes and lining cells
and no osteoblast undergoes apoptosis (ρA = 0). In contrast, in the concave configuration of an osteon, the thickness is limited by the maximum diameter of a cylinder that can be occupied by a single row of 128 osteoblasts (∼ 250 μm). In this case, approximately half of the initial osteoblasts must still undergo apoptosis if the observed osteocyte density is to be maintained at or near the normal osteocyte density in cortical bone.
References
-
- de Wynter E A, Emmerson A J, Testa N G. Properties of peripheral blood and cord blood stem cells. Baillieres Best Pract Res Clin Haematol. 1999;12(1-2):1–17. - PubMed
-
- Deans R J, Moseley A B. Mesenchymal stem cells: Biology and potential clinical uses. Exp Hematol. 2000;28(8):875–884. - PubMed
-
- Dua H S, Azuara-Blanco A. Limbal stem cells of the corneal epithelium. Surv Ophthalmol. 2000;44(5):415–425. - PubMed
-
- Rao M S. Multipotent and restricted precursors in the central nervous system. Anat Rec. 1999;257(4):137–148. - PubMed
-
- Sainio K, Raatikainen-Ahokas A. Mesonephric kidney—a stem cell factory? Int J Dev Biol. 1999;43(5):435–439. - PubMed
LinkOut - more resources
Full Text Sources
Other Literature Sources
