. 1992;2(4):353-63.

Analysis of the promoter of the cytochrome P-450 2B2 gene in the rat

Affiliations

Analysis of the promoter of the cytochrome P-450 2B2 gene in the rat

M Hoffmann et al. Gene Expr. 1992.

Abstract

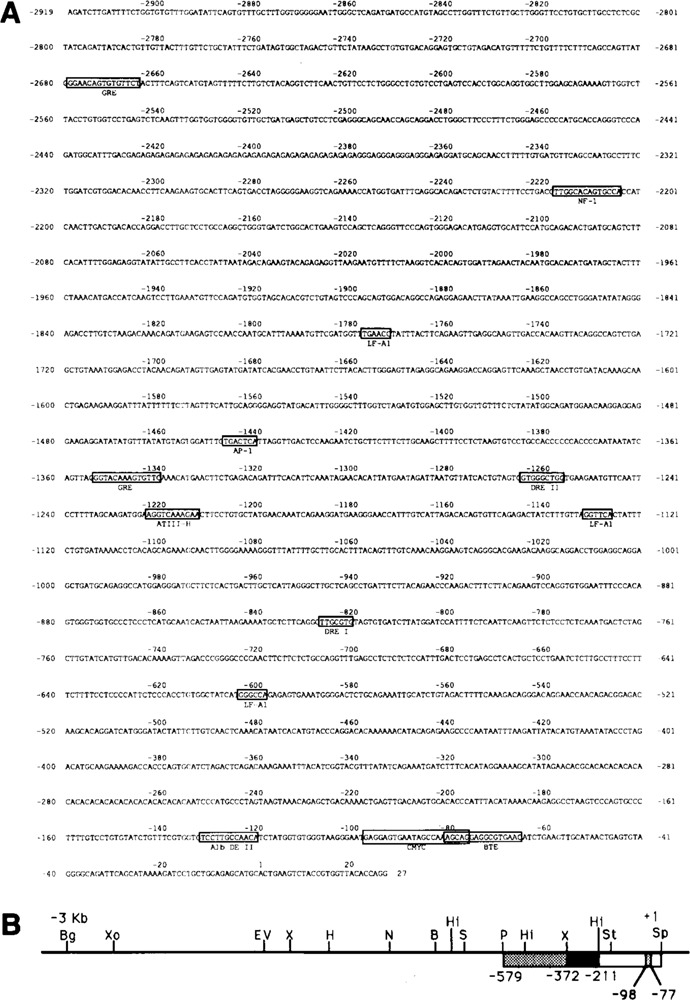
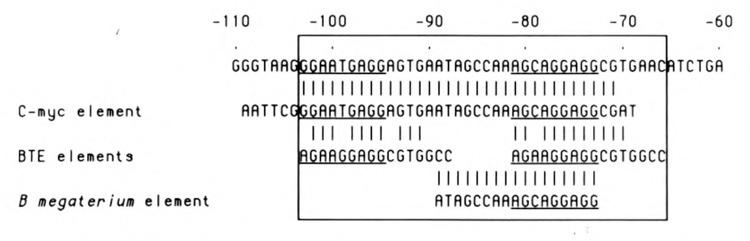
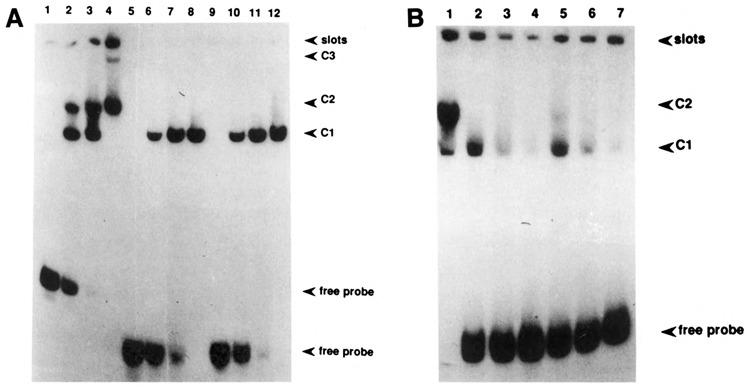
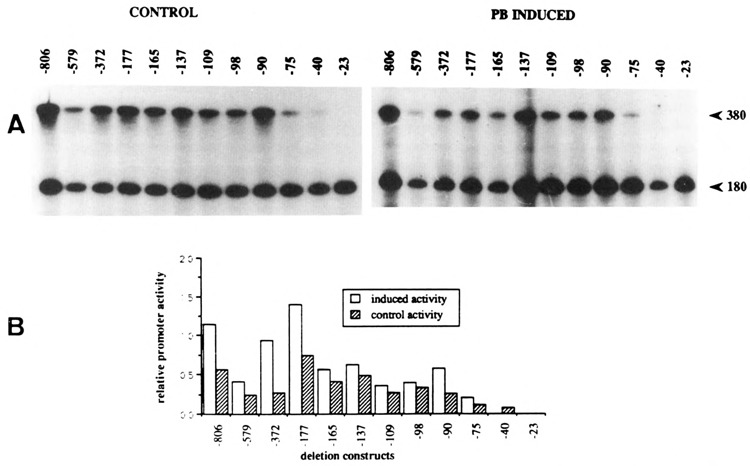
About 3 kb of the promoter region of the gene encoding cytochrome P-450 2B2 (CYP2B2) in the rat were sequenced and searched for potential cis-acting elements. Apart from putative binding sites for (liver-specific) protein factors, a region showing homology with the LINE 1 retrotransposon element was also found. Three proximal promoter fragments, encompassing nucleotides -579 to -372, -372 to -211, and -211 to +1, respectively, were shown to contain binding sites for multiple protein factors by bandshift analyses. The strongest protein-binding element, designated BRE (basic regulatory element), occurs between -103 to -66. Its structure is very similar to a negative control element in the murine cmyc promoter and displays a composite feature having a tandemly repeated sequence homology with the BTE (basic transcription element; Yanagida et al., 1990) separated by a CCAAA-box. The use of a deletion series of this template in in vitro transcription assays, provided evidence that the BRE serves as a major cis-acting element in the (regulated) transcription activation of the CYP2B2 gene.


Figures

Figure 1
Figure 1
Structure of the rat CYP2B2 promoter region. In A the sequence of 2919 bp of the promoter is shown. The location of putative protein factor binding sites is indicated, as well as the region showing homology with the LINE 1 element (discussed in the text). In B the physical map of the 5′-flanking region of the CYP2B2 gene is given, ranging from the transcription initiation point (+1) to 2919 bp upstream. B = BamH I, Bg = Bgl II, H = Hind III, Hi = Hinc II, N = Nco I, P = Pst I, S = Sma I, Sp = Sph I, St = Stu I, X = Xba I, EV = EcoR V, Xo = Xho I. Fragments used as probes in bandshift analyses are boxed. The location of the sequence from −98 to −77 of the proximal part of the CYP2B2 promoter showing homology with a c-myc regulatory element (see text) is indicated.
Figure 2
Figure 2
Mapping of the CYP2B2 transcription start site and slot blot analysis of CYP2B-mRNAs. A. RNase A protection assay of total liver RNA from 2,4,5 HCB-treated rats (lane 1), from control rats (lane 2), and from PB-treated rats (lane 3). The length of the RNase A protected riboprobe fragment (see Materials and Methods) was estimated relative to size markers (M). Arrows correspond to the mapped transcription start sites. B. Total liver RNA from rats treated for different time periods with PB were used for slot blot hybridization with a CYP2B gene-specific probe. A rat ribosomal protein L12 gene-specific probe was used as a loading control (result not shown).
Figure 3
Figure 3
Bandshift analyses of the proximal part of the CYP2B2 promoter. Three different probes, viz. the DNA fragments comprising nucleotides −579 to −372 (A), −372 to −211 (B), and −211 to +` (C) were incubated in the presence of liver nuclear ext acts from both PB-treated and control rats and analyzed for complex formation. A. Left panel: increasing amount of PB-induced extract; right panel: increasing amount of control extract. The positions at which free probe and complexes have migrated are indicated. B. Lane 1: free probe; lane 2: 2 μg PB-induced extract; lane 3: 2 μg control extract. C. Lane 1: free probe; lanes 2 and 4: 5 μg PB-induced and control extract, respectively; lanes 3 and 5: like lanes 2 and 4, but in the presence of a 1000-fold excess of the c-myc oligomer.
Figure 4
Figure 4
Bandshift analysis of the −104 to −71 oligomer. A. Lanes 1, 3, 5, and 7: 1.2, 2, 3.5, and 10 μg, respectively, of crude control extract; lanes 2, 4, 6, and 8: 1.2, 2, 3.5, and 10 μg, respectively of crude PB-induced extract. B. Crude nuclear PB-extract was chromatographed on a superose 12HR column (Pharmacia; result not shown), and consecutive fractions were then used for a band shift analysis of the oligomer. Numbers 1–8 correspond to these consecutive fractions, of which 15 μl were used in a total assay volume of 30 μl; lane 9: crude PB-extract; lane 10: free probe.
Figure 5
Figure 5
Comparison of sequence elements present in the proximal part of the CYP2B2 promoter. The nucleotide sequence of the region from −110 to −60 is aligned with the sequence of the “c-myc repressor oligomer” (Remmers et al., 1986), containing nucleotides −104 to −71, the BTE elements (Yanagida et al., 1990), and the element displaying homology with a sequence in the promoter of the B. megaterium cytP450 gene (He and Fulco, 1991). Oligomers encompassing the indicated sequences were used for the band shift analyses presented in Figures 4 and 6. The composite sequence element from −66 to −103 is designated BRE (basic regulatory element)—see text. The repeated protein factor binding motif RGNANGAGG is underlined.
Figure 6
Figure 6
Band shift analysis of the CYP2B2-oligomers indicated in Figure 5. A. Increasing protein concentrations were used: 0, 2.5, 5, and 10 μg of crude control extract for lanes 1–4, 5–8, and 9–12. Lanes 1–4: using the −104 to −71 (c-myc) oligomer as a probe; lanes 5–8: using the BTE-oligomer as a probe; and lanes 9–12: using the B. megaterium oligomer as a probe. B. Competition experiment: the −104 to −71 oligomer was used as a probe for a band shift analysis using 5 μg of crude control extract (lane 1). Lanes 2, 3, and 4: competition with 10, 20, and 50×, respectively, molar excess of BTE oligomer; lanes 5, 6, and 7: competition with 10, 20, and 50×, respectively, molar excess of the B. megaterium oligomer.
Figure 7
Figure 7
In vitro transcription on CYP2B2 promoter G-less templates. Deletion fragments of the CYP2B2 promoter cloned in the G-less cassette vector (see Materials and Methods) were used as templates for in vitro transcription, both in control and PB-induced nuclear extracts. The adenomajor late promoter fused to a 180 bp G-less fragment was used as internal reference. A. Left panel: control extracts; right panel: PB-induced extracts. B. Graphical representations. The autoradiographs shown in A were scanned using an LKB UltroScan Densitometer.

References

    1. Cereghini S., Raymondjean M., Carranca A. G., Herbomel M., and Yaniv M. (1987), Cell 50, 627–638. - PubMed
    1. Chomczynski P. and Sacchi N. (1987) Anal Biochem 64, 156–159. - PubMed
    1. Corcoran L. M., Cory S., and Adams J. M. (1985), Cell 40, 71–79. - PubMed
    1. Denison M. S., Fisher J. M., and Whitlock J. P. Jr. (1988), J Biol Chem 263, 17221–17224. - PubMed
    1. Fujisawa-Sehara A., Yamane M., and Fujii-Kuriyama Y. (1988), Proc Natl Acad Sci USA 85, 5859–5863. - PMC - PubMed

Substances

LinkOut - more resources