. 1992;2(2):147-60.

Mouse F9 teratocarcinoma stem cells expressing the stably transfected homeobox gene Hox 1.6 exhibit an altered morphology

Affiliations

Mouse F9 teratocarcinoma stem cells expressing the stably transfected homeobox gene Hox 1.6 exhibit an altered morphology

J A Goliger et al. Gene Expr. 1992.

Abstract

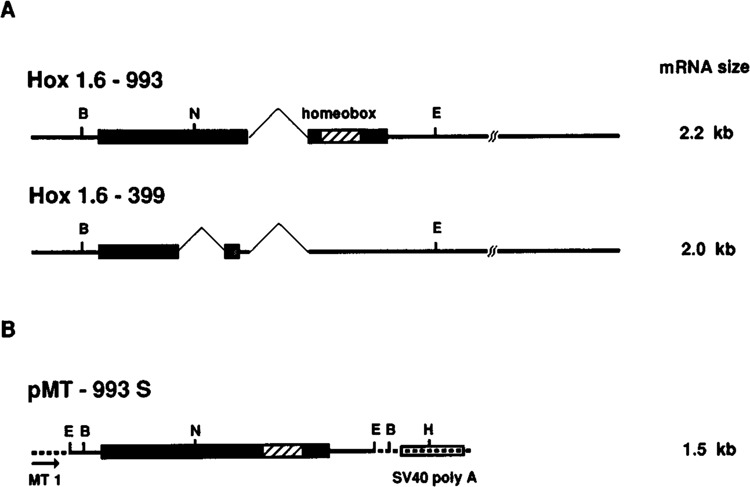
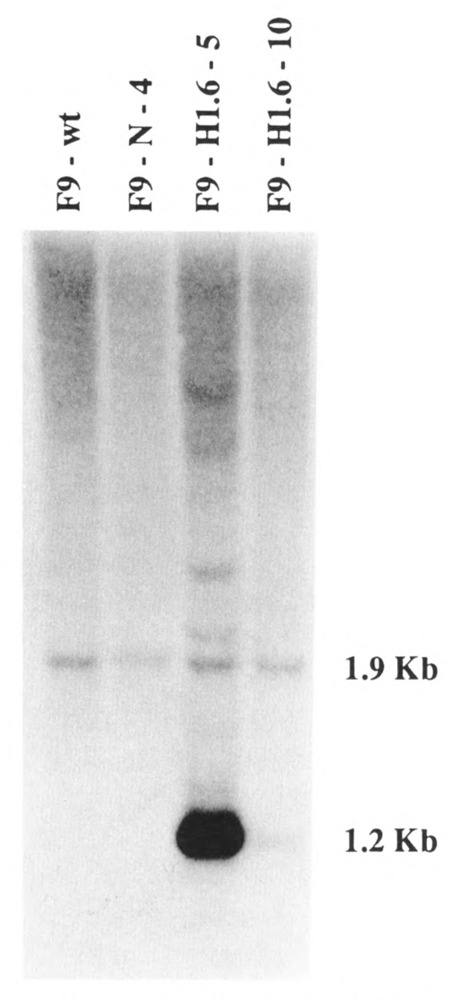
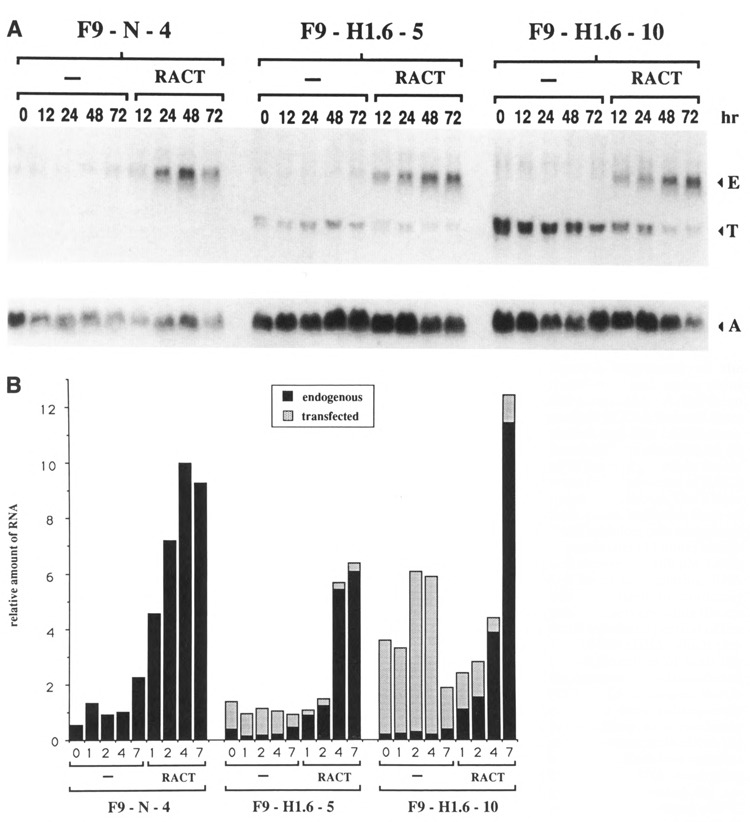
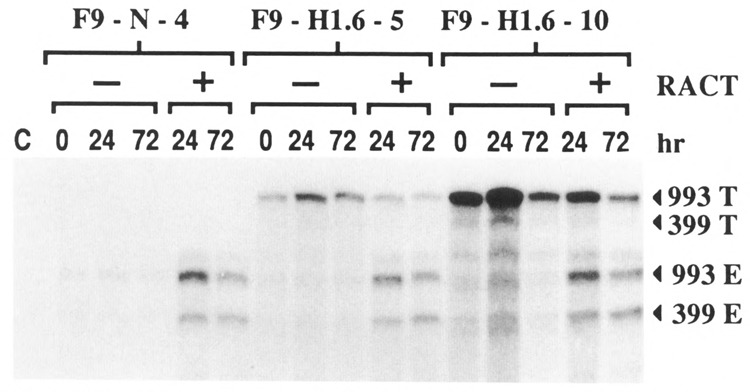
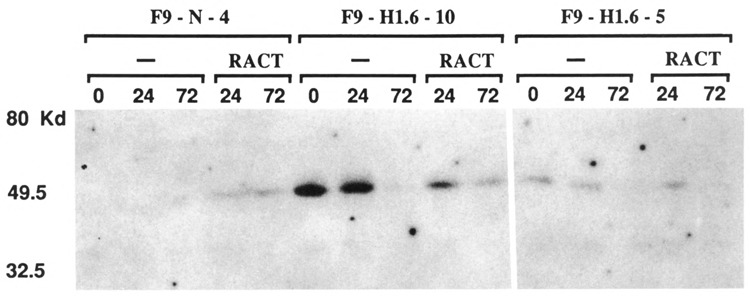
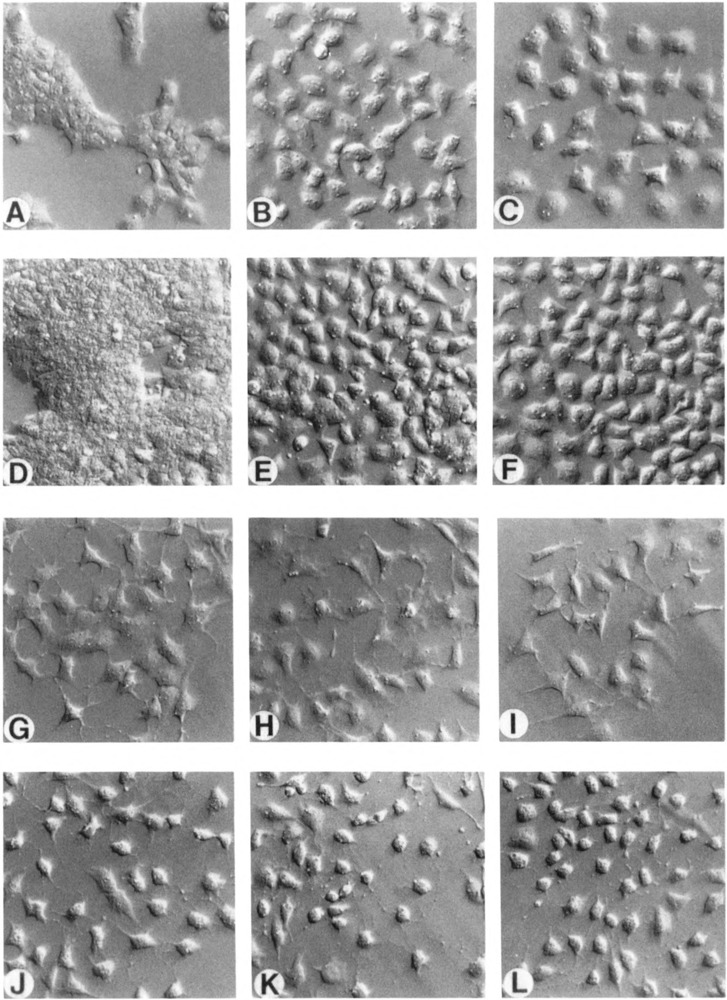
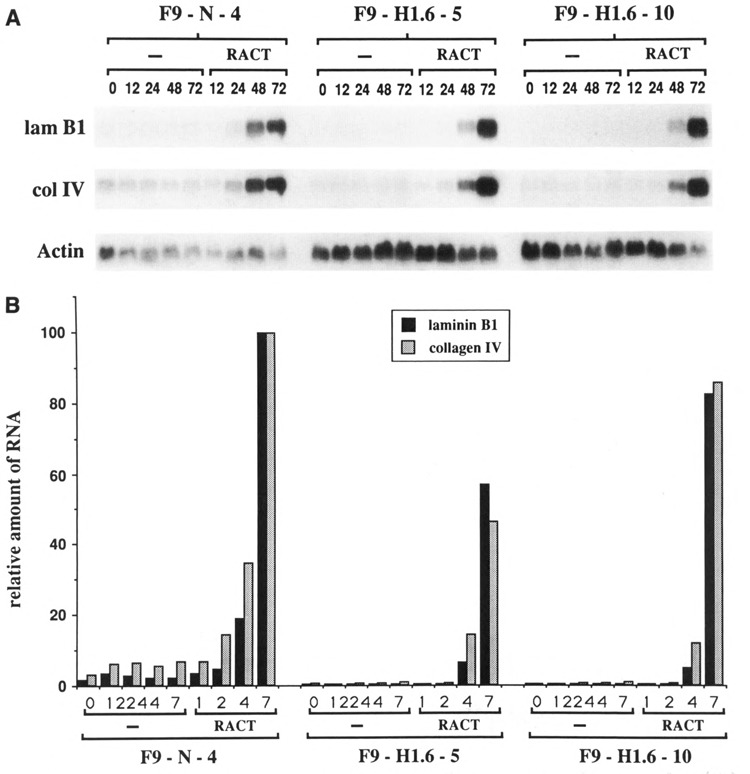
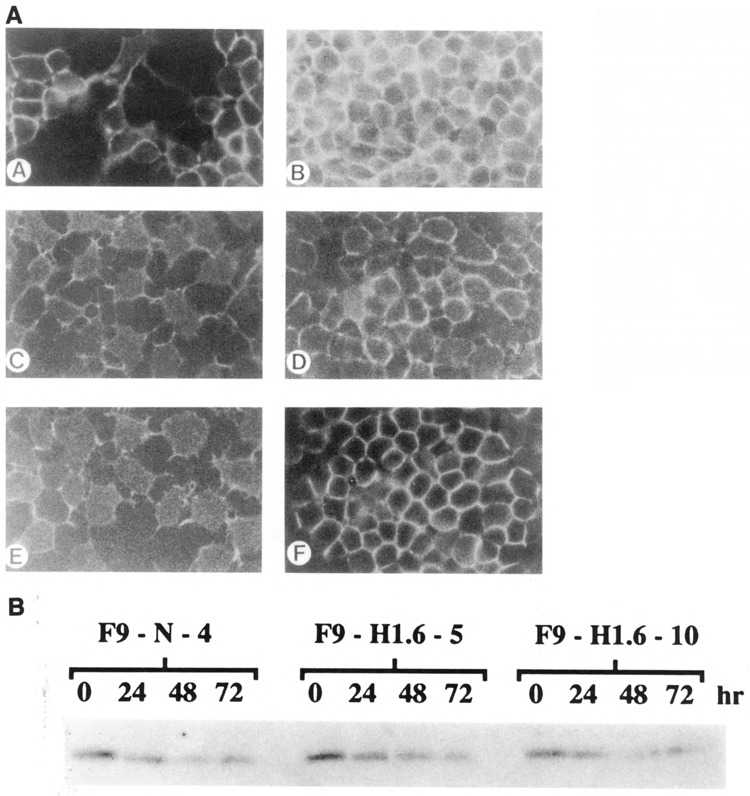
Expression of the murine homeobox gene Hox 1.6 rapidly increases in F9 teratocarcinoma cells when these cells are induced with retinoic acid to differentiate into primitive and parietal endoderm. Hox 1.6 encodes a putative transcriptional regulatory protein which may function as a secondary regulator of gene expression during the differentiation process. To examine the role of the Hox 1.6 gene, we have stably transfected F9 stem cells with a cDNA containing the complete coding sequence of Hox 1.6 under the control of the mouse metallothionein promoter. Two clonally distinct cell lines that express high levels of the transfected Hox 1.6 gene have been isolated and characterized. We show that expression of the transfected Hox 1.6 gene in F9 cells dramatically alters the stem cell morphology. However, the transfected cells do not differentiate in the absence of retinoic acid treatment, nor are they prevented from differentiating in response to such treatments. We therefore suggest that the Hox 1.6 gene controls the expression of genes which influence changes in F9 cell morphology during RA-induced differentiation.


Figures

Figure 1
Figure 1
Schematic representations of the Hox 1.6 gene transcripts and the plasmid pMT-993S. A. Endogenous transcripts from the Hox 1.6 gene are depicted. Open reading frames are indicated by rectangles; introns are indicated with thin lines drawn at 45° angles. The stipled rectangle in the Hox 1.6-399 transcript represents a shift in the reading frame due to the alternative splice. B = BamH I; N = Nde I; E = EcoR I. B. The relevant portion of plasmid pMT-993S used to stably transfect wild-type F9 cells. The mouse metallothionein promoter (MT1), the Hox 1.6-993 cDNA, and the SV40 polyadenylation sequences are depicted. The 5′ EcoR I restriction site (E) in pMT-993S is from a linker attached to the Hox 1.6-993 cDNA (LaRosa and Gudas, 1988a). The 3′ EcoR I restriction site in pMT-993S corresponds to the 3′ EcoR I site within the Hox 1.6 gene. B = BamH I; N = Nde I; H = Hpa I.
Figure 2
Figure 2
Southern analysis of the pMT-993S-transfected cell lines. Genomic DNA isolated from wild-type F9 cells (F9-wt) and from the transfected cell lines F9-N-4, F9-Hl.6-5, and F9-H1.6-10 was digested with BamH I and analyzed by Southern blot. The DNA on the Southern blot was hybridized to randomly primed probe to the translated portion of the Hox 1.6 cDNA. The 1.9 Kb fragment corresponds to the endogenous Hox 1.6 gene, and the 1.2 Kb fragment corresponds to the integrated Hox 1.6-993 cDNA insert. Exposure time was 24 hours at −70°C with an intensifying screen.
Figure 3
Figure 3
Expression of the transfected and endogenous Hox 1.6 mRNAs. A. Northern analysis of RNA isolated from control and Hox 1.6-993-transfected cell lines after 0,12,24,48, or 72 hours of growth in the absence (−) or presence of RACT-treatment is shown. The 0 hour time point indicates time of RACT addition; cells were plated approximately 16 hours earlier and exposed to 100 μM ZnCl2 4–5 hours after plating. RNA was hybridized to randomly primed insert encoding the entire 5′ translated portion of the Hox 1.6-993 cDNA, which permitted detection of both the endogenous (E) and transfected (T) Hox 1.6 messages. Northern blots were subsequently re-hybridized to a randomly primed mouse actin cDNA (A) as a control. Each lane contains 25 μg of total RNA. Autoradiograms were exposed for approximately 24 hours at −70°C with an intensifying screen to detect Hox 1.6 transcripts; autoradiograms were exposed for approximately 8 hours under similar conditions to detect actin transcripts. Northern analyses of these lines were performed three times with qualitatively similar results. B. Quantitative analysis of the Northern blot shown in A. Amounts of the transfected Hox 1.6-993 transcript and the endogenous Hox 1.6 transcript are relative to amounts of actin message and are plotted as a percent of the maximal amount of endogenous Hox 1.6 expression observed in the control F9-N-4 cell line.
Figure 4
Figure 4
Alternative splicing of the messages encoded by the Hox 1.6 gene. RNase protection experiments were performed as described in the text to examine alternative splicing of the transfected and endogenous Hox 1.6 gene transcripts. 15 μg of the RNA described in Figure 2 were used per reaction. Bands corresponding to the homeobox containing transfected message (993 T), the homeobox-less transfected message (399 T), the homeobox-containing endogenous message (993 E), and the homeobox-less endogenous message (399 E) are indicated. This experiment was performed two times with identical results.
Figure 5
Figure 5
Western analysis of the Hox 1.6 protein. Western analysis of the Hox 1.6 protein in control and pMT-993S-transfected cells is shown. Cells were grown as described in Figure 2 and harvested after 0, 24, or 72 hours of treatment, as indicated. 600 μg of total cell protein were resolved by SDS-PAGE, transferred to nitrocellulose, probed with a polyclonal antisera to Hox 1.6 (see Materials and Methods), and visualized using 125I-labeled protein A; exposure time was 21 days. This experiment was performed two times. Qualitatively similar results were observed in both experiments for all extracts except from F9-H 1.6-5 cells treated with RACT for 72 hours; a second experiment detected amounts comparable to those observed in control F9-N-4 cells treated with RACT for 72 hours (data not shown).
Figure 6
Figure 6
Growth morphology of control and pMT-993S transfected cells. F9-N-4 (A, D, G,J), F9-H1.6-5 (B, E, H, K), and F9-H1.6-10 (C, F, I, L) cells were grown for two (A–C) or four (D–L) days in the presence of 100 μM ZnCl2 alone (A–F), ZnCl2 + 1μM RA (G–I), or ZnCl2 + RACT (J–L), rinsed with warm PBS, and photographed with a Nikon inverted microscope equipped with Hoffman optics. Magnification is 200×.
Figure 7
Figure 7
Expression of laminin B1 and collagen IV (α1) genes. A. Northern analysis of laminin B1 (lam Bl) and collagen IV (αl) (col IV) mRNAs is shown. Blots described in Figure 2 were hybridized to randomly primed laminin B1 or collagen IV cDNAs. Autoradiographs were exposed at −70°C with an intensifying screen for approximately 12 hours. Northern blots were performed three times with qualitatively similar results. B. Quantitative analysis of the Northern shown in A. Amounts of laminin Bl and collagen IV message are relative to amounts of actin message and are plotted as a percent of the maximal amount of expression observed in the control F9-N-4 cell line.
Figure 8
Figure 8
Expression and localization of E-cadhherin. A. E cadherin expression and localization were detected by immunofluorescent staining of F9-N-4 (A, B), F9-H1.6-5 (C, D), and F9-H1.6-10 (E, F) stem cells growing at either low (A, C, E) or high (B, D, F) cell densities, as described in the text. Two-second exposures are shown for all cells. B. A Western analysis of E-cadherin is shown. Control and pMT-993S-transfected cells were grown in the presence of 100 μM ZnCl2 for indicated times. 500 μg of total cell protein were used per lane. Protein was visualized with 125I-labeled Protein A; autoradiographs were exposed for five days.

Similar articles

Cited by

References

    1. Ausebel F. M., Brent R., Kingston R. E., Moore D. D., Seidman J. G., Smith J. A., and Struhl K., eds. (1987), Current Protocols in Molecular Biology. Greene Publishing Associates and Wiley-Interscience, New York.
    1. Berget S. M. and Sharp P. A. (1979), J Mol Biol 129, 547–565. - PubMed
    1. Chirgwin J. M., Przybyla A. E., MacDonald R. J., and Rutter W. J. (1979), Biochemistry 18, 5294–5299. - PubMed
    1. Chisaka O., Musci T. S., and Capecchi M. R. (1992), Nature 355, 516–520. - PubMed
    1. Colberg-Poley A., Voss S., Chowdhury K., and Gruss P. (1985), Nature 314, 731–738. - PubMed

Publication types