. 2003 Dec;14(12):4783-93.
doi: 10.1091/mbc.e03-06-0354. Epub 2003 Sep 17.

Gangliosides that associate with lipid rafts mediate transport of cholera and related toxins from the plasma membrane to endoplasmic reticulm

Affiliations

Gangliosides that associate with lipid rafts mediate transport of cholera and related toxins from the plasma membrane to endoplasmic reticulm

Yukako Fujinaga et al. Mol Biol Cell. 2003 Dec.

Abstract

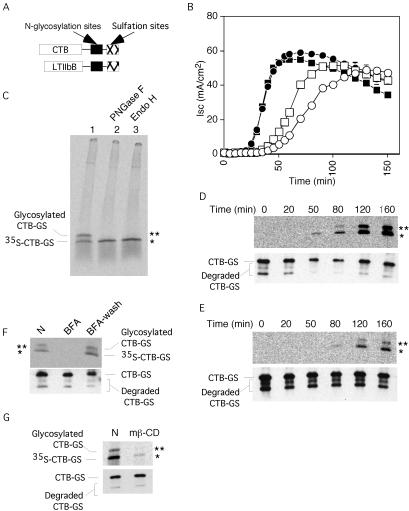
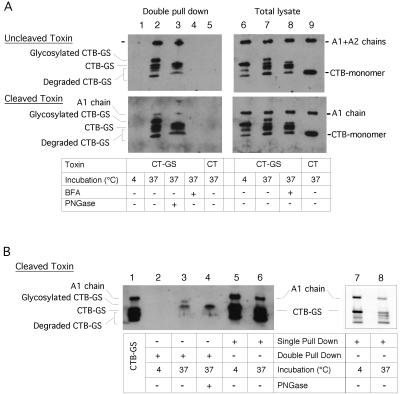
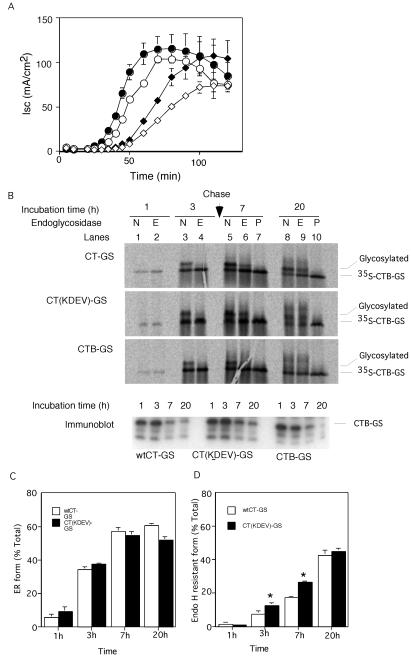
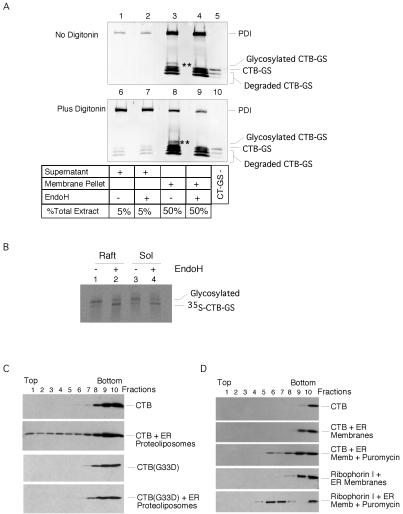
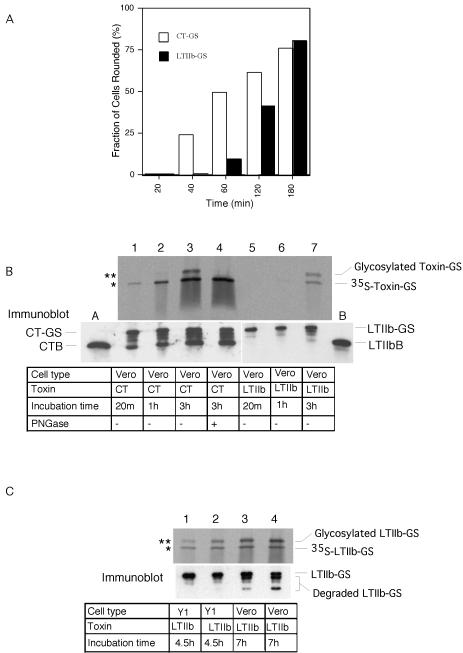
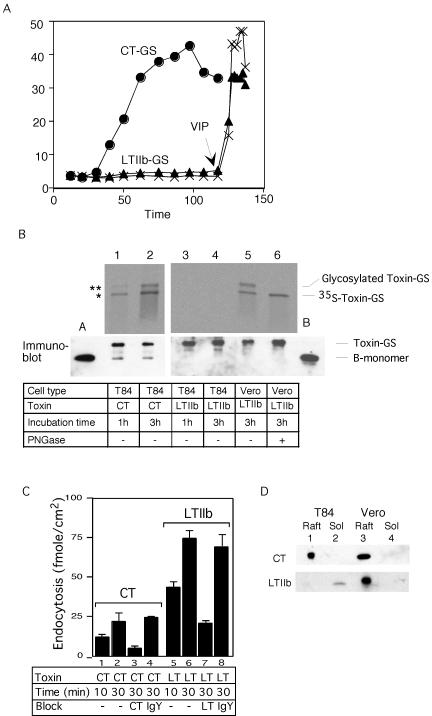
Cholera toxin (CT) travels from the plasma membrane of intestinal cells to the endoplasmic reticulum (ER) where a portion of the A-subunit, the A1 chain, crosses the membrane into the cytosol to cause disease. A related toxin, LTIIb, binds to intestinal cells but does not cause toxicity. Here, we show that the B-subunit of CT serves as a carrier for the A-subunit to the ER where disassembly occurs. The B-subunit binds to gangliosides in lipid rafts and travels with the ganglioside to the ER. In many cells, LTIIb follows a similar pathway, but in human intestinal cells it binds to a ganglioside that fails to associate with lipid rafts and it is sorted away from the retrograde pathway to the ER. Our results explain why LTIIb does not cause disease in humans and suggest that gangliosides with high affinity for lipid rafts may provide a general vehicle for the transport of toxins to the ER.


Figures

Figure 1.
Figure 1.
Transport of CT B-subunit into the Golgi and the ER. (A) N-Glycosylation and tyrosine sulfation sites added to the C terminals of CTB-subunit and LTIIbB-subunit. (B) Time course of Cl secretion measured as short circuit current (Isc) induced by 20 nM wt CT (squares) or CT-GS (circles) after application at 0 min to basolateral (filled symbols) or apical membranes (open symbols) of T84 monolayers. Representative of three independent experiments. (C) Phosphorimage showing sulfation (marked by *) and N-glycosylation (marked by **) of CT-GS B-subunit 3 h after apical and basolateral application to T84 cells. Immunoprecipitates were divided into three equal samples and treated with PNGaseF (lane 2), EndoH (lane 3), or mock treated (lane 1) before analysis by SDS-PAGE. Representative of two independent experiments. (D and E) Top, phosphorimages showing time course of 35S sulfation (*) and N-glycosylation (**) of B-subunit of CT-GS applied at 0 min to basolateral (D) or apical membranes (E) of T84 cells. Bottom, immunoblot for CT B-subunit to show equal loading for each lane. (F) Phosphorimage (top) showing effect of 10 μM BFA on sulfation and N-glycosylation of CT-GS B-subunit 3 h after application to T84 cells. T84 cells were treated (lane BFA) or not treated with BFA (lane N), or treated with BFA for 2 h, washed to remove BFA, and incubated again for an additional 3 h (lane BFA-wash). Bottom, immunoblot for CT B-subunit. (G) Phosphorimage (top) showing effect of methyl-β-cyclodextrin on sulfation and N-glycosylation of CT-GS B-subunit 3 h after application to T84 monolayers (lane mβ-CD) or mock-treated control (lane N). Bottom, immunoblot for CT B-subunit. Representative of two independent experiments.
Figure 2.
Figure 2.
Disassembly of the holotoxin occurs in the ER. (A) Immunoblot for A- and B-subunits after double affinity precipitation (by using concanavalin A then GM1-linked beads) for the N-glycosylated B-subunit or total cell lysate from Vero cells treated with CT-GS at 4°C (lanes 1 and 6), at 37°C for 5 h in buffer alone (lanes 2, 3, and 7) or at 37°C with BFA to inhibit retrograde transport (lanes 4 and 8). Lanes 5 and 9 show results for cells treated with wt CT that lacks the N-glycosylation motif. Lane 3 shows same sample as in lane 2 treated with PNGaseF. Both uncleaved (top two panels) and cleaved CT-GS (bottom two panels) were used. Both unglycosylated and degraded forms of CTB-GS monomers were pulled down in the pentameric B-subunit together with full-length glycosylated CT-GS monomers. Representative of two independent experiments. (B) Immunoblot for A- and B-subunits after double affinity precipitation as in A (lanes 2–4) or single precipitation by GM1-beads alone (lanes 5 and 6) as described in A. Lane 4 shows same sample as in lane 3 treated with PNGaseF. Lane 1 shows purified CT-GS as control. Lanes 7 and 8 show repeat immunoblot by using less material of the same samples shown in lanes 5 and 6. Representative of three independent experiments.
Figure 3.
Figure 3.
The A chain is not required for transport to the ER. (A) Time course of Isc induced by 20 nM wt CT-GS (filled symbols) or the KDEL-mutant CT(KDEV)-GS (open symbols) applied at 0 min to apical (diamonds) or basolateral membranes (circles) of polarized T84 monolayers, mean ± SD, n = 3. (B) T84 cells were loaded with Na235SO4 and exposed to 20 nM CT-GS (top), CT (KDEV)-GS (middle), or B-subunit only CTB-GS (bottom) for 3 h. At 3 h, cells were chased (arrow) with fresh medium. Sulfation and glycosylation were analyzed by SDS-PAGE and autoradiography at the indicated times of incubation. Samples were treated with EndoH (lanes 2, 4, 6, and 9, labeled E), PNGaseF (lanes 7 and 10, labeled P), or mock treated (lanes 1, 3, 5, and 8, labeled N) before analysis. Parallel samples were analyzed by immunoblot for CT B-subunit (bottom, labeled immunoblot). The total cellular content of B chains decreases in the chase period. Representative of three independent experiments. (C and D) Quantification of the N-glycosylated and EndoH-resistant forms of CTB-GS measured as percentage of total sulfated toxin as described in B [wt CT-GS, open bars, and CT(KDEV)-GS mutant, filled bars; mean ± SE, n = 3, *p < 0.05].
Figure 4.
Figure 4.
The B subunit is bound to GM1 in the ER. (A) Immunoblots of membrane and supernatant fractions for CT B-subunit and protein disulfide isomerase. Microsomes were prepared from Vero cells after incubation with CT-GS for 5 h at 37°C and membrane (lanes 3–4 and 8–9) and supernatant fractions (lanes 1–2 and 6–7) analyzed by immunoblot for CT B subunit or protein disulfide isomerase. Lanes 6–9 show microsomes permeabilized with low dose of digitonin. Lanes 4 and 9 are the same samples as in lanes 3 and 8 treated with endoglycosidase H. Lanes 5 and 10 show purified CT-GS as control. ** marks the EndoH-sensitive glycosylated form of GT-GS that always fractionates with the membrane pellet. (B) Phosphorimage of sulfation and N-glycosylation of CT-GS B-subunit immunoprecipitated from Triton X-100-insoluble (lipid raft) and -soluble fractions of T84 cells 5 h after application of toxin. Samples were treated or not treated with endoglycosidase H as indicated. (C) CT or the CT G33D mutant that cannot bind GM1 were incubated with proteoliposomes prepared from ER membranes isolated from canine pancreas, layered under a sucrose step gradient (lanes 8–10), and analyzed after equilibrium centrifugation by immunoblot. Toxin binding to the ER proteoliposomes is indicated by flotation into the gradient (lanes 1–7). Representative of two independent experiments. (D) CT was incubated with ER membranes isolated from canine pancreas, layered under a sucrose step gradient (lanes 8–10), and analyzed after equilibrium centrifugation by immunoblot for the CT B-subunit or the ER membrane protein ribophorin I. Toxin binding to the ER membranes is indicated by flotation into the gradient (lanes 1–7). Some ER membranes were also treated with puromycin to strip ribosomes. These membranes floated higher into the gradient after puromycin treatment and contained binding sites for CT showing the presence of GM1 in rough ER. A similar shift in density after treatment with puromycin was seen for the ER membrane protein ribophorin I. Representative of two independent experiments.
Figure 5.
Figure 5.
LTIIb-GS traffics retrograde into the ER of Y1 and Vero cells. (A) Time course of cAMP-dependent shape change induced by CT (open bars) or LTIIb (filled bars) incubated with Vero cells for the indicated times at 37°C. Fraction of rounded cells in 400 total cells counted (n = 2). (B) Phosphorimage (top) showing time course of sulfation (*) and N-glycosylation (**) of CT-GS (lanes 1–4) or LTIIb-GS B-subunits (lanes 5–7) after incubation with Vero cells for the indicated times at 37°C. Sample in lane 4 was treated with PNGaseF before analysis. Parallel samples were analyzed by Immunoblot for CT or LTIIb B-subunits (bottom). Lanes labeled A and B contain 3 ng of purified CT or LTIIb to provide single point calibration for mass of toxin loaded in each lane (nondegraded top band labeled CT-GS or LTIIb-GS). Representative of two independent experiments. (C) Phosphorimage (top) showing sulfation (*) and N-glycosylation (**) of LTIIb-GS B-subunits after incubation with mouse adrenal Y1 (lanes 1 and 2) or monkey kidney Vero cells (lanes 3 and 4) for 4.5 or 7 h at 37°C. Parallel samples were analyzed by immunoblot for LTIIb B-subunit to demonstrate equal loading of all lanes (bottom).
Figure 6.
Figure 6.
Specificity for GM1 in retrograde traffic (A) Time course of Isc induced by 20 nM CT-GS (circles) or 100 nM LTIIb-GS (triangles), or buffer alone (crosses) in T84 cells. The viability of monolayers exposed to LTIIb was demonstrated by application of the cAMP-agonist vasoactive intestinal peptide, VIP, at 120 min (arrow). (B) Phosphorimage (top) showing sulfation (*) and N-glycosylation (**) of CT-GS or LTIIb-GS B-subunits after incubation with T84 (lanes 1–4) or Vero cells (lanes 5 and 6) for 1 or 3 h at 37°C. Parallel samples analyzed by immunoblot for CT B-subunit show equal loading of all lanes (bottom). Lanes labeled A and B contain 3 ng of purified CT or LTIIb toxin to provide single point calibration for the mass of toxin loaded. Representative of two independent experiments. (C) Receptor-mediated endocytosis of 20 nM 125I-CT or 125I-LTIIb after 10- or 30-min incubations with T84 cells in the presence of 120 μM CT (column 3) or LTIIb (column 4) as competitive inhibitors, or 10 μg of chicken IgY (columns 4 and 8) or 0.5% albumin (lanes 1, 2, 5, and 6) as nonspecific controls. Mean ± SE, n = 3–5 independent studies. (D) Immunoblot for CT (top) or LTIIb (bottom) showing association of CT and LTIIb with lipid raft (Raft) and triton-soluble fractions (Sol) isolated from T84 (lanes 1 and 2) and Vero cells (lanes 3 and 4) preincubated with the indicated toxins at 4°C.

References

    1. Bagnat, M., Keranen, S., Shevchenko, A., and Simons, K. (2000). Lipid rafts function in biosynthetic delivery of proteins to the cell surface in yeast. Proc. Natl. Acad. Sci. USA 97, 3254–3259. - PMC - PubMed
    1. Bastiaens, P.I.H., Majoul, I.V., Verveer, P.J., Söling, H.-D., and Jovin, T.M. (1996). Imaging the intracellular trafficking and state of the AB5 quaternary structure of cholera toxin. EMBO J. 15, 4246–4253. - PMC - PubMed
    1. Brown, D., and London, E. (2000). Structure and function of sphingolipid- and cholesterol-rich membrane rafts. J. Biol. Chem. 275, 17221–17224. - PubMed
    1. Bundgaard, J.R., Vuust, J., and Rehfeld, J.F. (1997). New consensus features for tyrosine O-sulfation determined by mutational analysis. J. Biol. Chem. 272, 21700–21705. - PubMed
    1. Falguieres, T., Mallard, F., Baron, C., Hanau, D., Lingwood, C., Goud, B., Salamero, J., and Johannes, L. (2001). Targeting of shiga toxin b-subunit to retrograde transport route in association with detergent-resistant membranes. Mol. Biol. Cell 12, 2453–2468. - PMC - PubMed

Publication types

LinkOut - more resources