. 2004 Jan;15(1):371-83.
doi: 10.1091/mbc.e03-05-0338. Epub 2003 Sep 17.

The calcium binding loops of the cytosolic phospholipase A2 C2 domain specify targeting to Golgi and ER in live cells

Affiliations

The calcium binding loops of the cytosolic phospholipase A2 C2 domain specify targeting to Golgi and ER in live cells

John H Evans et al. Mol Biol Cell. 2004 Jan.

Abstract

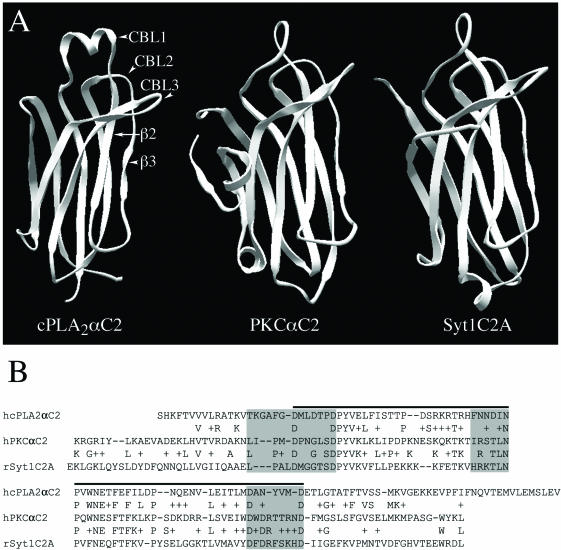
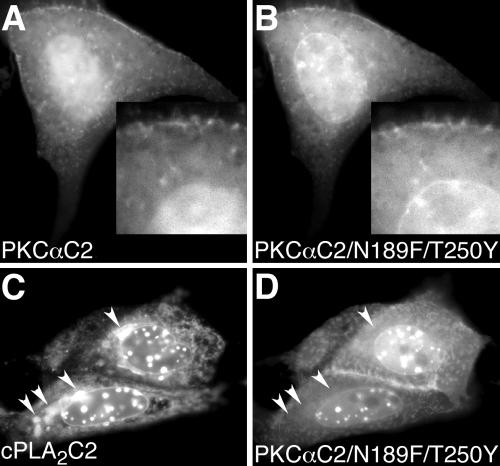
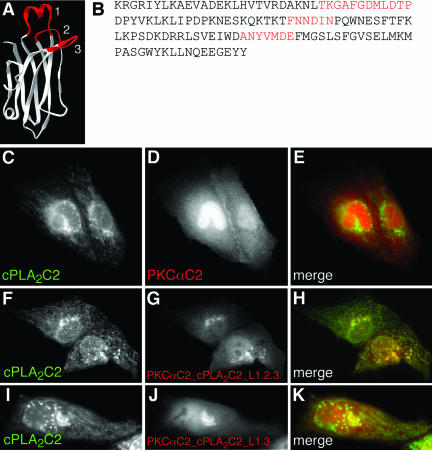
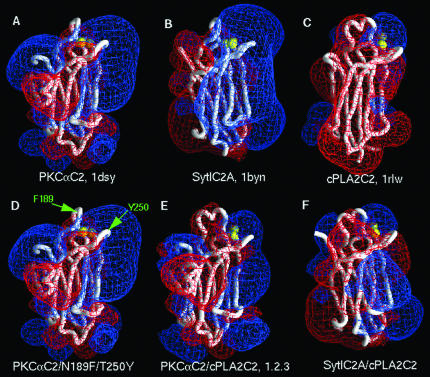
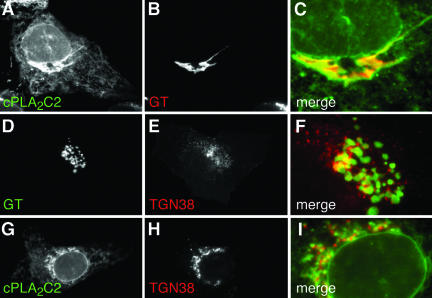
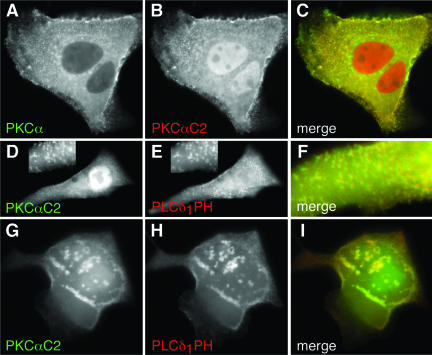
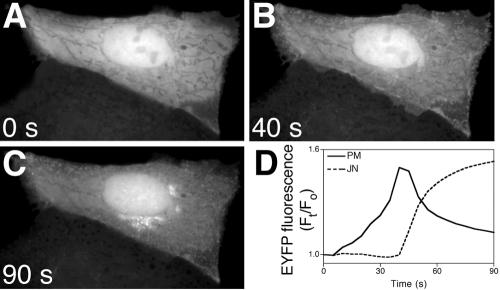
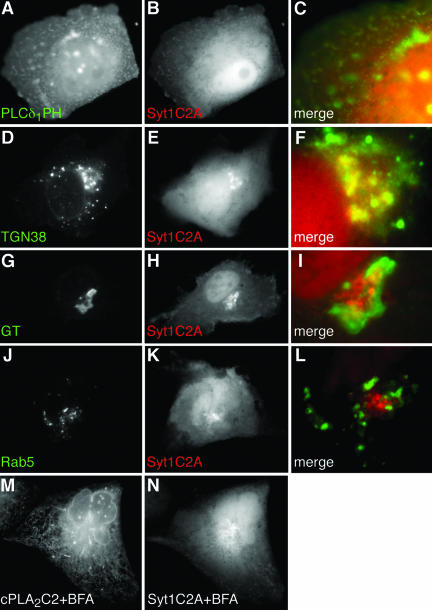
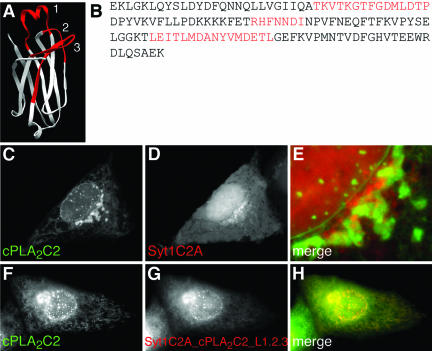
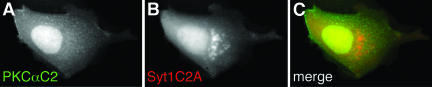
Translocation of cytosolic phospholipase A2 (cPLA2) to Golgi and ER in response to intracellular calcium mobilization is regulated by its calcium-dependent lipid-binding, or C2, domain. Although well studied in vitro, the biochemical characteristics of the cPLA2C2 domain offer no predictive value in determining its intracellular targeting. To understand the molecular basis for cPLA2C2 targeting in vivo, the intracellular targets of the synaptotagmin 1 C2A (Syt1C2A) and protein kinase Calpha C2 (PKCalphaC2) domains were identified in Madin-Darby canine kidney cells and compared with that of hybrid C2 domains containing the calcium binding loops from cPLA2C2 on Syt1C2A and PKCalphaC2 domain backbones. In response to an intracellular calcium increase, PKCalphaC2 targeted plasma membrane regions rich in phosphatidylinositol-4,5-bisphosphate, and Syt1C2A displayed a biphasic targeting pattern, first targeting phosphatidylinositol-4,5-bisphosphate-rich regions in the plasma membrane and then the trans-Golgi network. In contrast, the Syt1C2A/cPLA2C2 and PKCalphaC2/cPLA2C2 hybrids targeted Golgi/ER and colocalized with cPLA2C2. The electrostatic properties of these hybrids suggested that the membrane binding mechanism was similar to cPLA2C2, but not PKCalphaC2 or Syt1C2A. These results suggest that primarily calcium binding loops 1 and 3 encode structural information specifying Golgi/ER targeting of cPLA2C2 and the hybrid domains.


Figures

Figure 1.
Figure 1.
Structural and sequence comparisons of cPLA2C2, PKCαC2, and Syt1C2A domains. (A) Ribbon diagrams of cPLA2C2, PKCαC2, and Syt1C2A (Protein Data Bank entries 1RLW, 1DSY, and 1BYN, respectively) show CBLs 1-3 and β strands 2 and 3 of cPLA2C2 (homologous to β strands 3 and 4 of PKCαC2 and Syt1C2A). (B) Amino acid sequence alignment of cPLA2C2 (residues 17-138, AAB00789), PKCαC2 (residues 158-277, P17252), and Syt1C2A domains (residues 140-262, P21707). The residues included in the CBLs are shaded in gray and the residues in the conserved core are under the black line.
Figure 4.
Figure 4.
PKCαC2 domains containing hydrophobic residues target plasma and nuclear membranes, but not Golgi and ER. Images of a cell coexpressing (A) EYFP-PKCαC2 and (B) ECFP-PKCαC2/N189F/T250Y at 150 s after treatment with 10 μM IONO are shown. Insets in A and B show an enlarged area of the cell, including the nuclear membrane. Images of a cell coexpressing (C) EYFP-cPLA2C2 and (D) ECFP-PKCαC2/N189F/T250Y at 240 s after treatment with 10 μM IONO are shown. Arrowheads in C point to Golgi and, in D, to the same area as in C. Images are representative of at least five experiments performed on different days.
Figure 9.
Figure 9.
Hybrid PKCαC2/cPLA2C2 domains containing cPLA2C2 Ca2+-binding loops colocalize with cPLA2C2. (A) Ribbon diagram of the hybrid C2 domain with Ca2+-binding loops from cPLA2C2 (red) on a PKCαC2 backbone (white). (B) The amino acid sequence of the hybrid shows PKCαC2 sequence (black, K158-L183, D193-T214, P221-D246, F255-Y285) interrupted by insertion of cPLA2C2 loop sequences (red, T31-P42, F63-I67, A94-E100). Images of cells coexpressing (C) ECFP-cPLA2C2 and (D) EYFP-PKCαC2 at 45 s after treatment with 10 μM IONO are shown. (E) A merged image of C and D. Images of cells coexpressing (F) EYFP-cPLA2C2 and (G) ECFP-PKCαC2_cPLA2C2_L1.2.3 at 90 s after treatment with 10 μM IONO are shown. (H) A merged image shows the overlap of F and G. Images of cells coexpressing (I) EYFP-cPLA2C2 and (J) ECFP-PKCαC2_cPLA2C2_L1.3 in medium supplemented with 5 mM CaCl2 at 42 s after treatment 10 μM IONO are shown. (K) A merged image shows the overlap of I and J.
Figure 10.
Figure 10.
Electrostatic properties of C2 domains of known structure, mutants, and hybrid models. In each panel, the structure or model is represented as a Cα backbone worm (white), and calcium ions are represented as yellow spheres. The electrostatic potentials were calculated and visualized in GRASP (Nicholls et al., 1991) for 0.1 M KCl. The red and blue meshes represent, respectively, the -25 and +25 mV equipotential profiles. (A) PKCαC2. (B) Syt1C2A. (C) cPLA2C2. (D) PKCαC2/N189F/T250Y; F189 and Y250 are denoted by green arrows. (E)PKCαC2_cPLA2C2_L1.2.3.(F)Syt1C2A_cPLA2 C2_L1.2.3. The structures in A, B, and C were taken from the Protein Data Bank, and the hybrid models in D, E, and F were constructed as described in MATERIALS AND METHODS.
Figure 2.
Figure 2.
The cPLA2 C2 domain targets Golgi and ER. Images of a cell coexpressing (A) EYFP-cPLA2C2 and (B) ECFP-GT at 27 s after treatment with 10 μM IONO are shown. A merged image (C) shows the region of the Golgi from A and B. Images of a cell coexpressing (D) ECFP-GT and (E) TGN38-EYFP, and (F) a merged image of D and E in the region of TGN and Golgi are shown. Images of cells coexpressing (G) ECFP-cPLA2C2 and (H) TGN38-EYFP at 30 s after treatment with 10 μM IONO are shown. A merged image (I) shows the region of the TGN. Images are representative of a minimum of five experiments.
Figure 3.
Figure 3.
PKCα C2 domain is responsible for PKCα targeting and targets PIP2-rich regions in the plasma membrane. Images of a cell coexpressing (A) ECFP-PKCα and (B) EYFP-PKCαC2 at 15 s after treatment with 10 μM IONO are shown. (C) A merged image of A and B. Images of a cell coexpressing (D) EYFP-PKCαC2 and (E) ECFP-PLCδ1PH at 10 s after treatment with 10 μM IONO are shown. Focusing is on the dorsal surface of the cell. Insets in D and E show an enlarged area of the cell. A merged image (F) shows a smaller region of the cell. Images of a cell coexpressing (G) EYFP-PKCαC2 and (H) ECFP-PLCδ1PH at 21 s after treatment with 10 μM IONO are shown. Focusing is on the ventral surface of the cell. A merged image (I) shows overlap of images G and H. Images are representative of a minimum of five experiments.
Figure 5.
Figure 5.
The Syt1C2A domain exhibits a biphasic pattern of translocation. Images of a cell expressing EYFP-Syt1C2A in medium supplemented with 5 mM CaCl2 treated with 10 μM IONO show distribution of Syt1C2A (A) before, (B) 40 s and (C) 90 s after addition of IONO. (D) Quantification of fluorescence change at areas corresponding to the plasma membrane (PM, solid line) and the juxtanuclear (JN, dotted line) regions of the cell in images A-C. Images and graph are representative of six independent experiments.
Figure 6.
Figure 6.
Syt1C2A targets TGN and PIP2-rich regions in the plasma membrane. Images of a cell coexpressing (A) ECFP-PLCδ1PH and (B) EYFP-Syt1C2A in medium supplemented with 5 mM CaCl2 at 9 s after treatment with 10 μM IONO are shown. A merged image (C) shows a region of the cell membrane. Images of a cell coexpressing (D) TGN38-ECFP and (E) EYFP-Syt1C2A in medium supplemented with 5 mM CaCl2 at 56 s after treatment with 10 μM IONO are shown. A merged image (F) shows the region of the TGN. Images of a cell coexpressing (G) ECFP-GT and (H) EYFP-Syt1C2A in medium supplemented with 5 mM CaCl2 at 20 s after treatment with 10 μM IONO are shown. A merged image (I) shows the region of TGN and Golgi. Images of a cell coexpressing (J) ECFP-Rab5 and (K) EYFP-Syt1C2A in medium supplemented with 5 mM CaCl2 at 20 s after treatment with 10 μM IONO are shown. A merged image (L) shows the region of early endosomes and TGN. Cells coexpressing (M) ECFP-cPLA2C2 and (N) EYFP-Syt1C2A were treated for 1.5 h with 100 μM BFA at 37°C before stimulation with 10 μM IONO in medium supplemented with 5 mM CaCl2. Images are 20 s after stimulation. Images are representative of a minimum of five experiments.
Figure 8.
Figure 8.
A hybrid Syt1C2A/cPLA2C2 domain containing cPLA2C2 Ca2+-binding loops colocalizes with cPLA2C2. (A) Ribbon diagram of the hybrid C2 domain with Ca2+-binding loops from cPLA2C2 (red) on a Syt1C2A backbone (white). (B) The amino acid sequence of the hybrid shows Syt1C2A sequence (black, E140-A165, D178-T195, N203-T223, G241-K267) interrupted by insertion of cPLA2C2 loop sequences (red, T28-P42, R61-I67, L87-I102). Images of cells coexpressing ECFP-cPLA2C2 (C) and EYFP-Syt1C2A (D) in medium supplemented with 5 mM CaCl2 at 55 s after treatment with 10 μM IONO are shown. (E) A merged image of C and D. Images of cells coexpressing (F) EYFP-cPLA2C2 and (G) ECFP-Syt1C2A_cPLA2C2_L1.2.3 in medium supplemented with 5 mM CaCl2 at 70 s after treatment with 10 μM IONO are shown. (H) A merged image of F and G.
Figure 7.
Figure 7.
Syt1C2A and PKCαC2 target different subcellular organelles in response to a [Ca2+]i increase. Cells coexpressing (A) ECFP-PKCαC2 and (B) EYFP-Syt1C2A in medium supplemented with 5 mM CaCl2 at 55 s after treatment with 10 μM IONO are shown. (C) A merged image of A and B. Images are representative of a minimum of five experiments.

References

    1. Almholt, K., Arkhammar, P.O., Thastrup, O., and Tullin, S. (1999). Simultaneous visualization of the translocation of protein kinase C alpha-green fluorescent protein hybrids and intracellular calcium concentrations. Biochem. J. 337, 211-218. - PMC - PubMed
    1. Arcaro, A., Volinia, S., Zvelebil, M.J., Stein, R., Watton, S.J., Layton, M.J., Gout, I., Ahmadi, K., Downward, J., and Waterfield, M.D. (1998). Human phosphoinositide 3-kinase C2 beta, the role of calcium and the C2 domain in enzyme activity. J. Biol. Chem. 273, 33082-33090. - PubMed
    1. Balla, T., and Varnai, P. (2002). Visualizing cellular phosphoinositide pools with GFP-fused protein-modules. Science's Stke: signal transduction knowledge environment. PL3. - PubMed
    1. Ben-Tal, N., Honig, B., Miller, C., and McLaughlin, S. (1997). Electrostatic binding of proteins to membranes. Theoretical predictions and experimental results with charybdotoxin and phospholipid vesicles. Biophys. J. 73, 1717-1727. - PMC - PubMed
    1. Ben-Tal, N., Honig, B., Peitzsch, R.M., Denisov, G., and McLaughlin, S. (1996). Binding of small basic peptides to membranes containing acidic lipids: theoretical models and experimental results. Biophys. J. 71, 561-575. - PMC - PubMed

Publication types

MeSH terms

LinkOut - more resources