

A genomewide screen of 345 families for autism-susceptibility loci
- PMID: 13680528
- PMCID: PMC1180610
- DOI: 10.1086/378778
A genomewide screen of 345 families for autism-susceptibility loci
Abstract
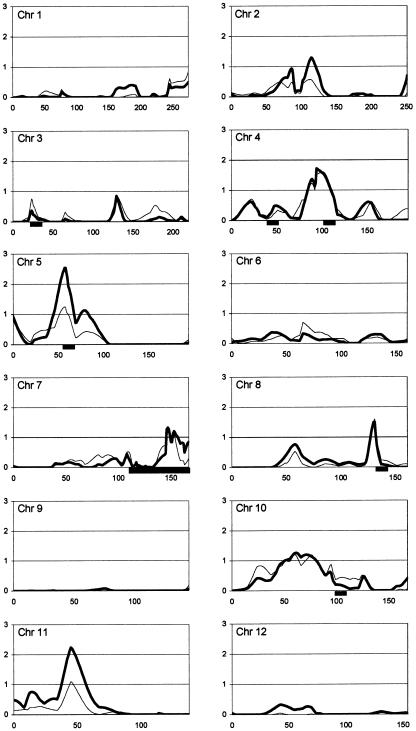
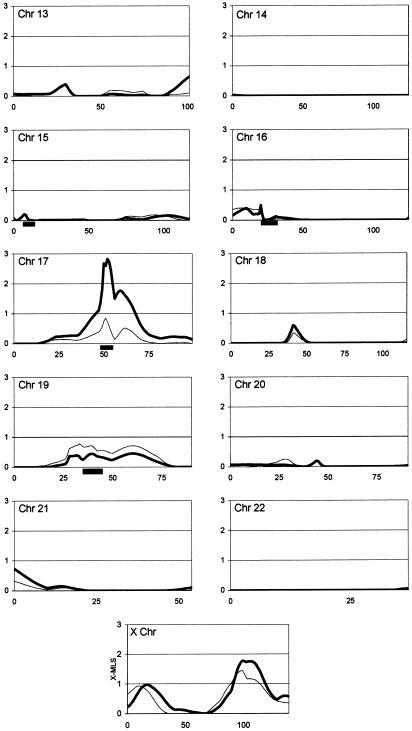
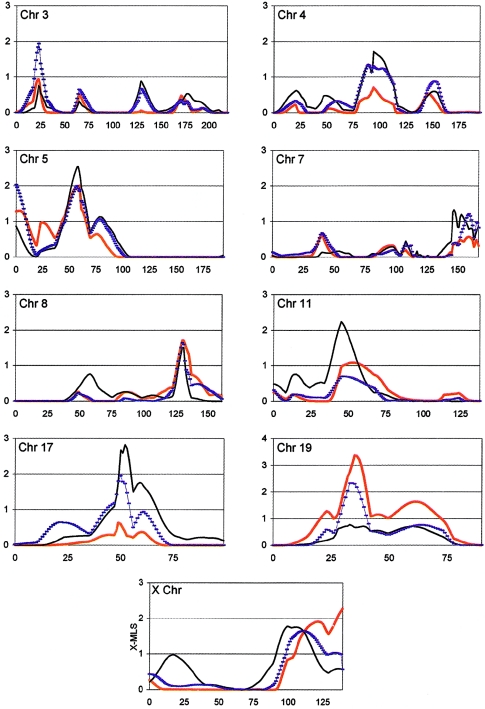
We previously reported a genomewide scan to identify autism-susceptibility loci in 110 multiplex families, showing suggestive evidence (P <.01) for linkage to autism-spectrum disorders (ASD) on chromosomes 5, 8, 16, 19, and X and showing nominal evidence (P <.05) on several additional chromosomes (2, 3, 4, 10, 11, 12, 15, 18, and 20). In this follow-up analysis we have increased the sample size threefold, while holding the study design constant, so that we now report 345 multiplex families, each with at least two siblings affected with autism or ASD phenotype. Along with 235 new multiplex families, 73 new microsatellite markers were also added in 10 regions, thereby increasing the marker density at these strategic locations from 10 cM to approximately 2 cM and bringing the total number of markers to 408 over the entire genome. Multipoint maximum LOD scores (MLS) obtained from affected-sib-pair analysis of all 345 families yielded suggestive evidence for linkage on chromosomes 17, 5, 11, 4, and 8 (listed in order by MLS) (P <.01). The most significant findings were an MLS of 2.83 (P =.00029) on chromosome 17q, near the serotonin transporter (5-hydroxytryptamine transporter [5-HTT]), and an MLS of 2.54 (P =.00059) on 5p. The present follow-up genome scan, which used a consistent research design across studies and examined the largest ASD sample collection reported to date, gave either equivalent or marginally increased evidence for linkage at several chromosomal regions implicated in our previous scan but eliminated evidence for linkage at other regions.
Figures
References
Electronic-Database Information
-
- Autism Genetic Resource Exchange, http://www.agre.org/ (for full diagnostic protocol for AGRE families)
-
- Center for Medical Genetics, Marshfield Medical Research Foundation, http://research.marshfieldclinic.org/genetics/
-
- Cure Autism Now Foundation, http://www.canfoundation.org/
-
- Online Mendelian Inheritance in Man (OMIM), http://www.ncbi.nlm.nih.gov/Omim/
-
- UCSC Genome Bioinformatics, http://genome.cse.ucsc.edu/
References
-
- Adams P (1994) LABMAN and LINKMAN: a data management system specifically designed for genome searches of complex diseases. Genet Epidemiol 11:87–98 - PubMed
-
- Aita VM, Liu J, Knowles JA, Terwilliger JD, Baltazar R, Grunn A, Loth JE, Kanyas K, Lerer B, Endicott J, Wang Z, Penchaszadeh G, Gilliam TC, Baron M (1999) A comprehensive linkage analysis of chromosome 21q22 supports prior evidence for a putative bipolar affective disorder locus. Am J Hum Genet 64:210–217 - PMC - PubMed
-
- American Psychiatric Association (2000) Diagnostic and statistical manual of mental disorders, 4th ed, text revision. American Psychiatric Association, Washington, DC
Publication types
MeSH terms
Grants and funding
LinkOut - more resources
Full Text Sources
Other Literature Sources
Molecular Biology Databases
