. 1992 May 1;148(9):2690-702.

Identification and analysis of a novel human surface CD5- B lymphocyte subset producing natural antibodies

Affiliations

Identification and analysis of a novel human surface CD5- B lymphocyte subset producing natural antibodies

M T Kasaian et al. J Immunol. .

Abstract

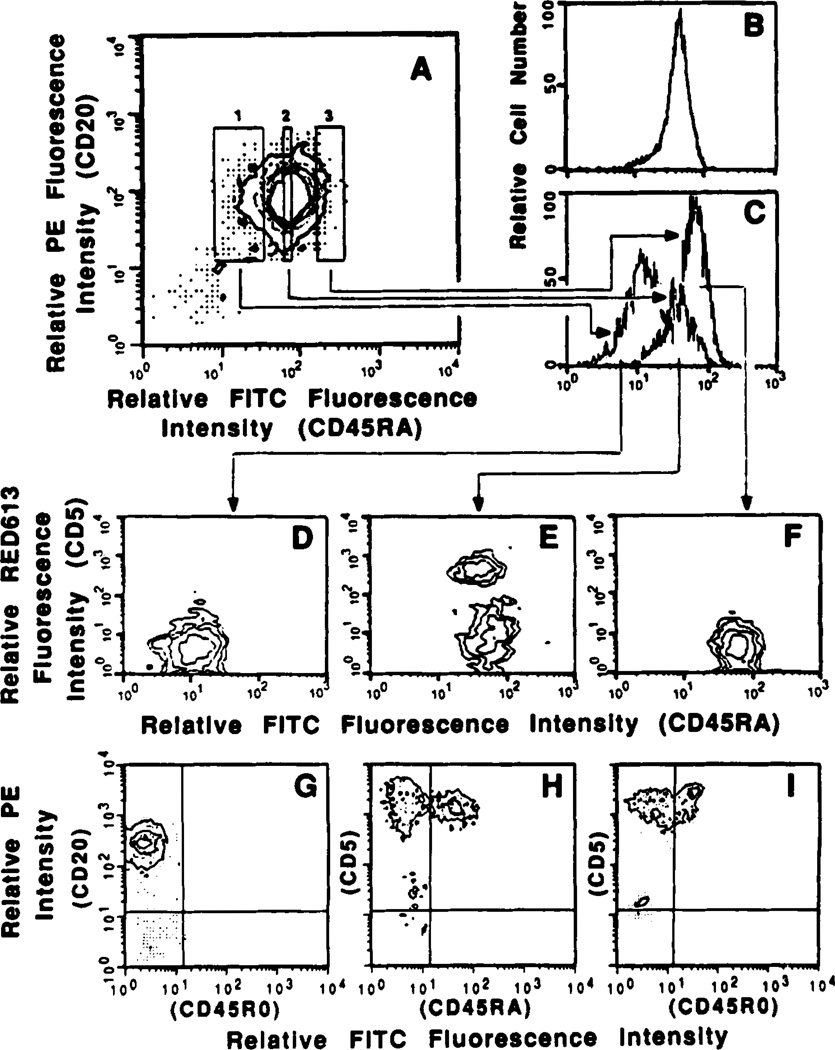
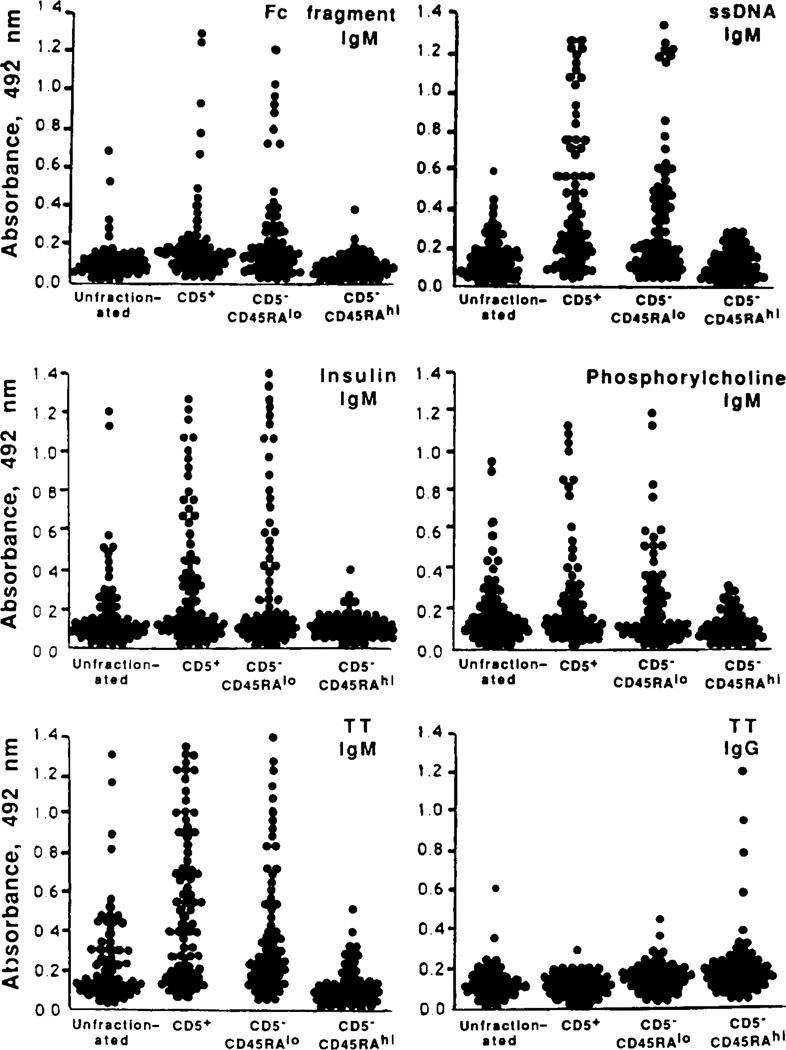
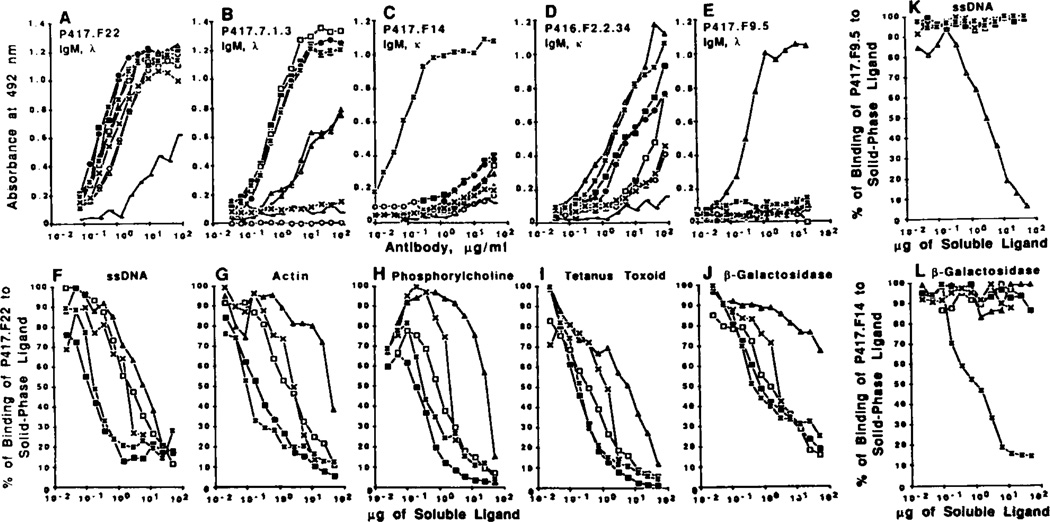
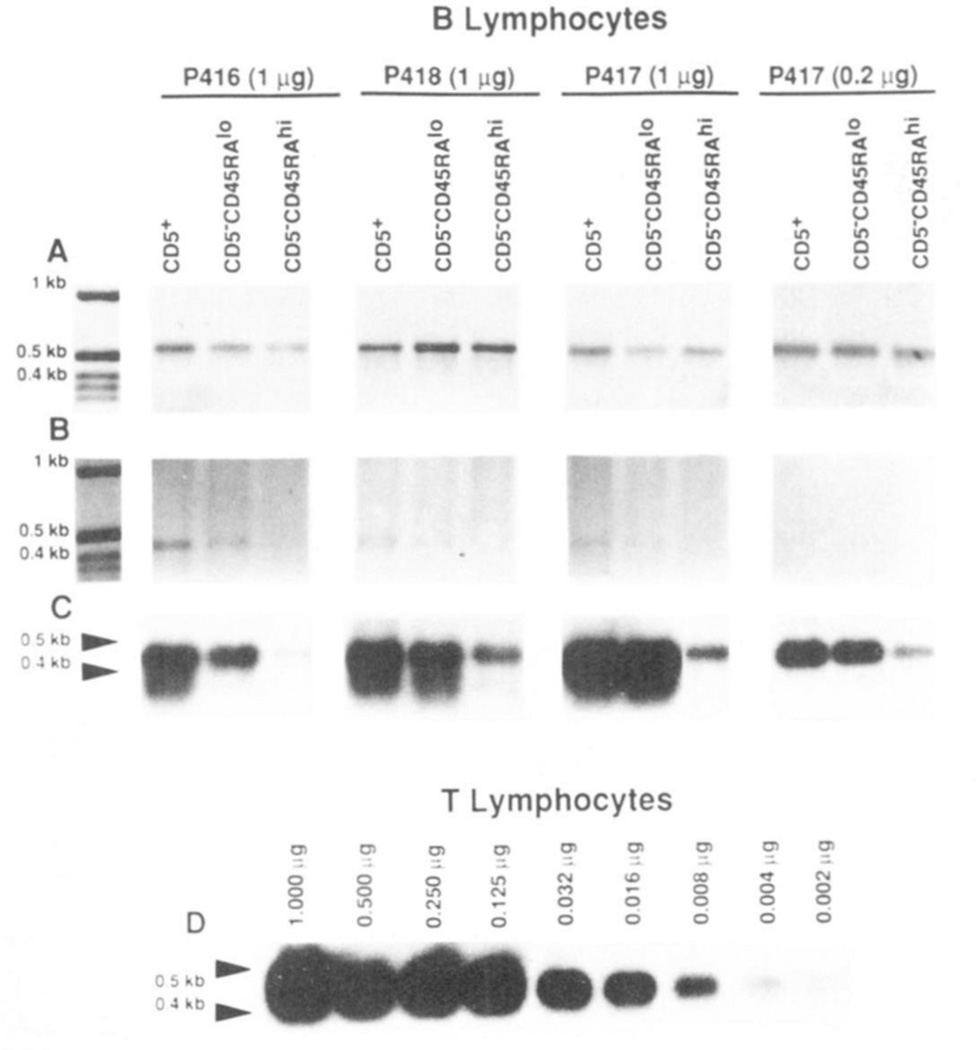
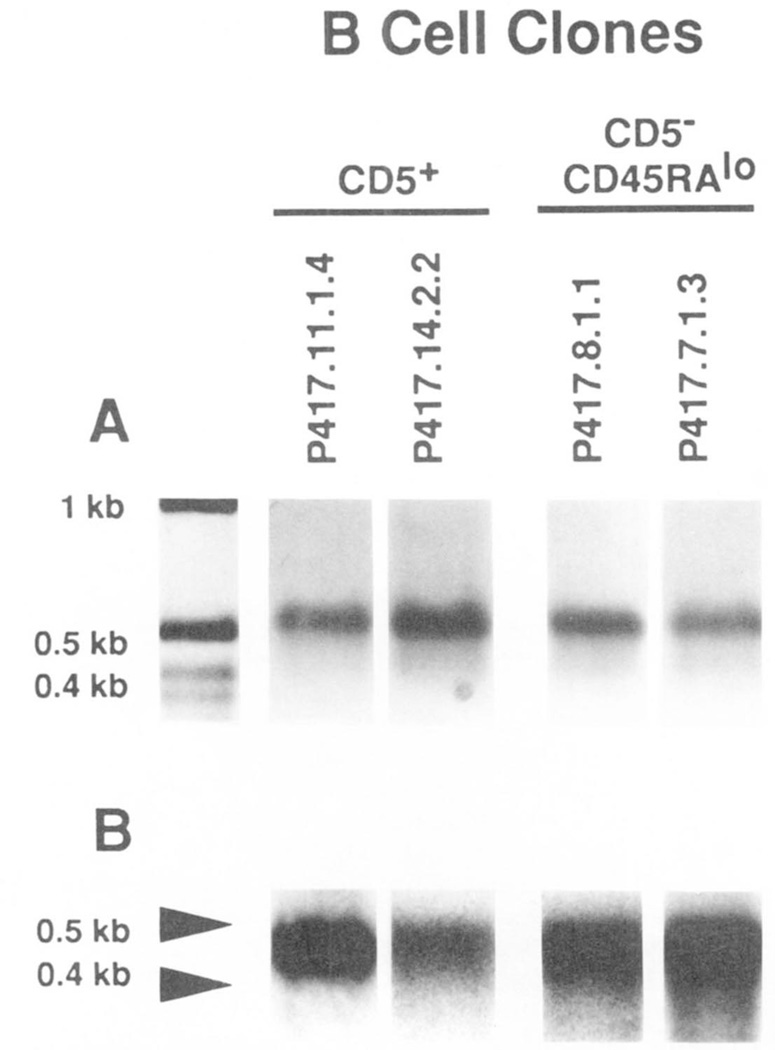
The production of "natural" autoantibodies or antibodies, i.e., Ig that bind a variety of self- and/or exogenous Ag and arise independently of known immunization, is though to be a feature of CD5+ B lymphocytes. To determine whether other lymphocyte subsets exist that might be committed to the production of natural antibodies, human peripheral blood B cells were sorted on the basis of surface CD5 expression and differential expression of surface CD45RA (CD5+CD45RAintermediate(int), CD5-CD45RAlow(lo), and CD5-CD45RAhigh(hi)), and analyzed for the type of Ig produced after EBV infection and culture. Like their CD5+ counterparts, most CD5-CD45RAlo B lymphocytes were precursors of cells producing IgM, a major proportion of which displayed the Ag-binding features of natural antibodies. In contrast, CD5-CD45RAhi B cells comprised a high frequency of IgG-producing cell precursors, possibly including memory B lymphocytes. Six of seven IgM mAb generated from sorted CD5-CD45RAlo B cells and three of four IgM mAb from sorted CD5+ B cells were polyreactive, binding with different affinities (Kd, 10(-5) to 10(-8) M) to two or more Ag; the remaining mAb from CD5-CD45RAlo and the mAb from CD5+ B cells each bound to a single Ag (Kd, 10(-7) to 10(-8) M), beta-galactosidase and ssDNA, respectively. CD5-CD45RAlo B cells account for 4.1 +/- 1.2% (mean +/- SD in 11 healthy subjects; CD5+ B cells, 23.3 +/- 6.9%) of total B lymphocytes and display the features of quiescent cells. In a given individual, the number of CD5-CD45RAlo B cells remains constant over time. CD5-CD45RAlo and CD5+ B cells bear surface CD11b and CD14, at densities and/or frequencies apparently higher than those of CD5-CD45RAhi B lymphocytes. Despite their surface CD5- phenotype, CD45RAlo B cells express CD5+ mRNA at levels comparable with those of CD5+ B lymphocytes, whereas CD5-CD45RAhi B cells express only trace amounts of CD5 mRNA. The commitment to natural antibody production and the degree of CD5 mRNA expression suggest that the newly defined CD5-CD45RAlo B cell subset is related to CD5+ B lymphocytes, and may constitute the human homologue of the mouse Ly-1-"sister" B cell population.


Figures

Figure 1
Figure 1
Expression of surface CD45RA and CD5 by human B lymphocytes. Peripheral blood B cells (more than 98% CD20+) from a healthy subject were reacted with PE-labeled mAb to CD20 and FITC-labeled mAb to CD45RA and applied to the FACS. Lymphocytes within rectangles 1, 2, and 3 (A) were sorted as CD45RAlo, CD45RAint, and CD45RAhi B cells, respectively. (Each sorted fraction contained more than 99% CD20+ cells). Profiles of sorted cells analyzed for FITC fluorescence intensity (C) were compared with those obtained from similar analysis of the unfractionated cells (B). The mean FITC fluorescence intensities of the sorted B lymphocytes as determined by reanalysis were: CD5CD45RAlo B cells, 11: CD5+ B cells, 45; and CD5CD45RAhi B cells, 64. To determine which cell fraction contained CD5+ B lymphocytes, sorted CD45RAlo, CD45RAint, and CD45RAhi cells were reacted with biotinylated mAb to CD5 followed by RED613-labeled streptavidin, and analyzed by two-color fluorescence flow cytometry (D, E, and F, respectively). G depicts the contourgrams derived from the analysis of the unfractionated B cells after reaction with PE-labeled mAb to CD20 in conjunction with FITC-labeled mAb to CD45RO. H and I depicts the contourgrams derived from the analysis of autologous T lymphocytes after reaction with PE-labeled mAb to CD5 in conjunction with FITC-labeled mAb to CD45RA and FITC-labeled mAb to CD45RO, respectively. In B to F, only the first three logs of the four-log range of green fluorescence intensity are depicted.
Figure 2
Figure 2
Sorting of CD5CD45RAlo, CD5CD45RAhi, and CD5+ B cells and analysis of their light scattering properties. Purified B lymphocytes from three subjects (A to C) were simultaneously reacted with PE-labeled mAb to CD5 and FITC-labeled mAb to CD45RA. Cells within rectangles 1, 2, and 3 of A were sorted as CD5CD45RAlo, CD5+, and CD5CD45RAhi B lymphocytes, respectively. D to F show contourgrams derived from the reanalyses of some of the cells from each sorted fraction. The percentages of sorted lymphocytes falling back within the original sorting windows, as determined by reanalysis, was 80% for CD5+ (D), 93% for CD5 CD45RAlo(E), and 90% for CD5D45RAhi (F). Contourgrams in insets depict the forward and side light scattering properties of the unsorted cells (A), and of the three sorted cell fractions (D to F). Single parameter profiles in insets of B and C depict the forward light scattering properties of CD5CD45RAlo (.....), CD5CD45RAhi (-.-), and CD5+ B cells (——). The forward light-scattering profiles of CD5CD45RAlo and CD5+ B cells overlap.
Figure 3
Figure 3
Surface CD11b and CD14 in PBMC and purified B lymphocyte subsets. PBMC were reacted with PE-labeled mAb to CD5, FITC-labeled mAb to CD20, and i) mAb to CD11b (IgMκ), followed by biotinylated goat F(ab′)2 fragments to mouse IgM, and then RED613-labeled streptavidin (A), or ii) biotinylated mAb to CD14 (IgG2aκ), followed by RED613-labeled streptavidin (B). Three-color fluorescence analysis was performed. T cells were gated according to their high level of expression of CD5, B cells according to their expression of CD20, and monocytes according to their high forward and right angle light-scattering properties. The RED613 fluorescence intensity of each cell fraction was then determined. To analyze CD11b and CD14 surface expression in the different B cell subsets, CD5+, CD5CD45RAlo, and CD5CD45RAhi B lymphocytes sorted from a healthy subject were reacted with: i) biotinylated mouse IgG1κ of irrelevant specificity (open profiles) or biotinylated mouse mAb to human CD11b (IgG1κ) (solid profiles), followed by RED613-labeled streptavidin (C, E, and G); or ii) biotinylated mouse IgG2aκ of irrelevant specificity (open profiles) or biotinylated mouse mAb to human CD14 (IgG2aκ) (solid profiles), followed by RED613-labeled streptavidin (D, F, and H). Single parameter analyses of RED613 fluorescence were performed.
Figure 4
Figure 4
Ag-binding activities of the antibodies produced by unfractionated, CD5+, CD5CD45RAlo, CD5CD45RAhi B lymphocytes. Sorted B cells were infected with EBV for 1 h and then seeded in culture at 250/well in the presence of irradiated feeders. After 3 wk, culture fluids were tested for the presence of antibodies to five Ag using specific ELISA. Each dot represents the Ag-binding activity (expressed as absorbance at 492 nm) of IgM or IgG in the fluid of a single microculture. Eighty microcultures established using B cells from three different subjects were assayed in each column. Fc fragment is the Fc fragment of human IgG. The amount of IgM produced over a 3-wk period by 250 EBV-transformed B cells ranged from about 1500 ng (CD5CD45RAhi B cells) to 3000 ng (CD5CD45RAlo and CD5+ B cells).
Figure 5
Figure 5
A to E, dose-dependent binding of IgM mAb generated using CD5CD45RAlo (A to C) and CD5+ B cells (D and E) to solid phase ligands. Ag-binding activity of each mAb is expressed as optical absorbance at 492 nm. F to J, dose-dependent inhibition of the binding of mAb P417.F22 to solid phase ligands by soluble homologous or heterologous ligands. Samples of mAb P417.F22 (0.4 µg) were incubated with increasing amounts of soluble ligand. After 18 h, mixtures were transferred to ELISA plates precoated with ssDNA (F), actin (G), phosphorylcholine (H), tetanus toxoid (I) or β-galactosidase (J), K and L, dose-dependent inhibition of the binding of mAb P417.F9.5 (K) and mAb P417.F14 (L) to solid phase ssDNA and β-galactosidase, respectively. In the competitive inhibition experiments, the amount of mAb bound to the solid phase Ag is expressed as a percentage of the binding activity measured in the absence of any soluble ligand (100% of binding activity). The following Ag were used: IgG Fc fragment (○), ssDNA (Δ), insulin (●), thyroglobulin (▲), actin (□), phosphorylcholine (×), tetanus toxoid (▪), β-galactosidase (*), and LPS (——).
Figure 6
Figure 6
Expression of cell surface CD5 in the different B cell subsets. Sorted CD5CD45RAlo (·····), CD5CD45RAhi (-·-), and CD5+ (——) B cells (donor P417) were transformed with EBV, grown in bulk culture for 3 wk, and reacted with: biotinylated mouse IgG2aκ, of irrelevant specificity, followed by PE-labeled streptavidin (A, three profiles virtually overlapping) or PE-labeled mAb to CD5 (IgG2aκ) (B, two profiles virtually overlapping). The monoclonal EBV-transformed cell lines generated by sequential cloning from sorted CD5CD45RAlo or CD5+ B cells were reacted with PE-labeled mAb to CD5 and subjected to FACS analysis. The fluorescence profiles of the CD5CD45RAlo B cell-derived lines P417.8.1.1 and P417.7.1.3 were compared one to one with those of the CD5+ B cell-derived lines P417.11.1.4 and P417.14.2.2 (C and D).
Figure 7
Figure 7
Expression of CD5 mRNA by CDS+, CD5CD45RAlo, and CD5CD45RAhi B cells from three healthy subjects (P416, P417, and P418). mRNA from each B cell subset (1 µg or 0.2 µg) or T lymphocytes (1.0 to 0.002 µg) was reverse transcribed. cDNA was amplified by PCR using β-actin-specific or CD5-specific primers, and analyzed on a 1.2% agarose gel (see Materials and Methods for details). A and B show ethidium bromide stained gels with amplified β-actin (~0.6 kb) and CD5 (~0.45 kb) cDNA. respectively, prepared from the three B cell subsets. C depicts the hybridization of the 32P-labeled CD5-specific oligonucleotide probe to fractionated amplified CD5 cDNA of the material in B. D depicts the hybridization of the 32P-labeled CD5-specific oligonucleotide probe to fractionated, amplified cDNA reverse transcribed from different amounts (1.0 to 0.002 µg) of purified T cell mRNA.
Figure 8
Figure 8
Expression of CD5 mRNA by EBV-transformed CD5+ and CD5CD45RAlo B cell lines. mRNA (1 µg) was extracted from two EBV-transformed monoclonal B cell lines derived from the sorted CD5+ B cells (P417.11.1.4 and P417.14.2.2) and two derived from the sorted CD5D45RAlo B cells (P417.8.1.1 and P417.7.1.3) of donor P417. mRNA was divided Into two aliquots, and then reverse transcribed. cDNA was amplified by PCR using the β-acttn (A, ethidium bromide staining) or CD5 (B, Southern hybridization)-specific primers and then fractionated on a 1.2% agarose gel. Southern hybridization was performed using the 32P-labeled CD5-specific oligonucleotide probe.

References

    1. Hayakawa K, Hardy RR, Herzenberg LA. Progenitors for Ly-1 B cells are distinct from progenitors for other B cells. J. Exp. Med. 1985;161:1554. - PMC - PubMed
    1. Herzenberg LA, Stall AM, Lalor PA, Sidman C, Moore WA, Parks DR, Herzenberg LA. The LY-1 B cell lineage. Immunol. Rev. 1986;93:81. - PubMed
    1. Hayakawa K, Hardy RR. Normal, autoimmune, and malignant CD5+ B cells: the Ly-1 B lineage? Annu. Rev. Immunol. 1988;6:197. - PubMed
    1. Kipps TJ. The CD5 B cell. Adv. Immunol. 1989;47:117. - PubMed
    1. Casali P, Notkins AL. Probing the human B cell repertoire with EBV: polyreactive antibodies and CD5+ B lymphocytes. Annu. Rev. Immunol. 1989;7:513. - PubMed

Publication types

MeSH terms

LinkOut - more resources