. 1963 Nov:18:1294-304.
doi: 10.1152/jappl.1963.18.6.1294.

INDOCYANINE GREEN DENSITOMETRY IN FLOWING BLOOD COMPENSATED FOR BACKGROUND DYE

INDOCYANINE GREEN DENSITOMETRY IN FLOWING BLOOD COMPENSATED FOR BACKGROUND DYE

A W EDWARDS et al. J Appl Physiol. 1963 Nov.

Abstract

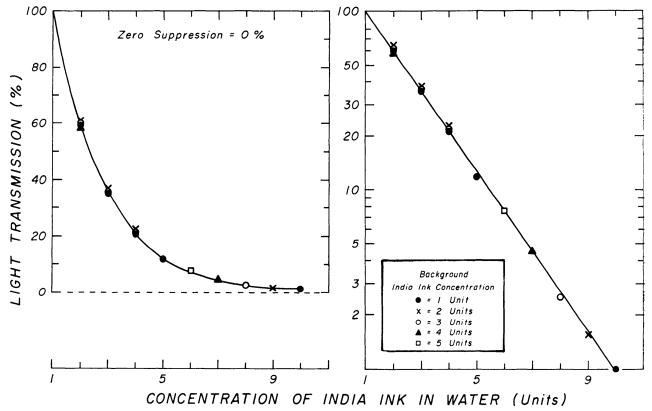
Blood is nonhomogeneous; hence, the relationship between light transmission and increasing concentration of dye in whole blood is never the perfect exponential curve predicted by Beer’s law. Instead, as the concentration of indocyanine green is increased to high levels (40 mg/liter) the light transmission decreases exponentially toward an asymptote at 6–8% transmission for nearly monochromatic densitometers (half-band width: 13–20 mμ), but at 30–40% for densitometers using light of wide-band width. Consequently, following recording of a dilution curve, circulating background dye reduces the change in transmission per unit increase in dye concentration in subsequent curves. This decrease in sensitivity cannot be compensated for by a simple increase in the sensitivity of the densitometer or in the intensity of its light source. Compensation can be attained, however, if increasing densitometer sensitivity is associated with the automatic scale expansion provided when a suppressed zero point is used. At correct zero suppression, the deflection for zero output of the densitometer coincides with the asymptotic transmission value mentioned above.


Figures

FIG. 1
FIG. 1
Densitometer for measurement of dye concentration in flowing blood. A = male hypodermic adapter for connection to catheters or needles; B = housing containing light source and filter assembly; C = nylon tubing protected by coil spring for connection to assembly for withdrawing blood samples at constant rate of flow.
FIG. 2
FIG. 2
Cross-sectional diagram of densitometer. 1 = aluminum housing for light-source and interference-filter assembly; 2 = 6.3-v lamp; 3 = interference- filter assembly including lens system for collimating light and then focusing filtered light on lumen (transmission peak of filter = 797 mμ half-band width = 20 mμ); 4 = clear polymeric methyl methacrylate (Lucite) window covering lumen; 5 = connection to lumen which is milled from black Lucite; 6 = phototube housing; 7 = phototube; 8 = vacuum tube of impedance-matching circuit (cathode follower); 9 = metal mounting rod containing leads to control circuits.
FIG. 3
FIG. 3
Control circuit for interference-filter, phototube densitometer. A = phototube (Du Mont K-1573); B = lumen of densitometer through which blood sample is drawn; C = tungsten filament light source (220 cycles/min, 6.3 v, 0.3 amp); D = on-off switch for light source; E = vacuum tube (12AU7) for cathode follower; F = potentiometer control for cathode-follower bias voltage; G = main control switch; H = sensitivity potentiometer for use with blood in the lumen; I = switch for checking mechanical zero of recording galvanometer, K; J = sensitivity potentiometer for use with saline in the lumen; V = battery-voltage source in volts; K = resistances in thousands of ohms.
FIG. 4
FIG. 4
Comparison of calibration curves for the Beckman DU spectrophotometer and three densitometers using India ink in water. One unit of concentration was 0.2% of the concentration of the stock solution. The origins of all curves were set at 100% (full scale) deflection for 0.2% India ink. The straight lines were drawn through this point and the point in the 10–20% deflection range. The differences in slope may be attributable to differences in cuvette depth. The adherence to Beer’s law in each instrument indicates linearity of the detecting system to equal decrements in incident light.
FIG. 5
FIG. 5
Calibration curves of four densitometers for indocyanine green in whole blood. The data on densitometers D1, D2, and D3 illustrate that when the waveband of incident light is narrow, that is, nearly monochromatic, the calibration curves are similar and differ little from the relationship expected from Beer’s law. In densitometer D2U, a light leak around the interference filter gave a wide (polychromatic) waveband of incident light and resulted in marked deviation from Beer’s law. (Deviations from Beer’s law over the range 0–30 mg/liter were: D1 = 6%;D2 = 6%; D3 = 8%; D2U = 38%.)
FIG. 6
FIG. 6
Calibration curves of four densitometers for indocyanine green in plasma. In comparison with the data given in Fig. 5 for the dye in whole blood, there is less deviation from Beer’s law when the dye is dissolved in plasma. Thus, the presence of red cells in itself causes deviation from Beer’s law. (Deviations from Beer’s law, assessed over the range 0–60 mg/liter were: Beckman DU = 1%; D1 = 2.6%; D3 = 5.9%; D2U = 37%.)
Fig. 7
Fig. 7
Calibration curves of dye and India ink in whole blood superimposed on the corresponding curves when in plasma or water, for two densitometers. To superimpose the lower ends of the curves, the concentration scales have been adjusted. The values obtained with whole blood as the diluent are connected by solid lines. The dashed straight lines are visual best fits to the values obtained using water or plasma as the diluent. Note that the presence of red cells caused a systematic deviation whether measuring concentrations of indocyanine green or India ink.
FIG. 8
FIG. 8
Effect of the degree of O2 saturation of the blood on the calibration of four densitometers for indocyanine green in whole blood. In all densitometers, higher O2 saturations were associated with greater sensitivity to dye. The effect of varying O2 saturations was less in those instruments in which the curves deviated least from Beer’s law. That is, the order of merit of these four instruments with respect to Beer’s law and to constancy of calibration in the presence of various O2 saturations was D1, D24, D3, and D2U. The data from D2U illustrate the adverse effect of the use of polychromatic incident light on the calibration characteristics of a densitometer.
FIG. 9
FIG. 9
Effect of hematocrit value on the calibration curves of two densitometers for indocyanine green in whole blood. Variation in hematocrit value from 30 to 70% had little effect on the calibration curve of densitometer D1, in which the incident light was relatively monochromatic. In D2U, in which polychromatic incident light was used, the effect of hematocrit value was somewhat more evident. In both, an increase in hematocrit value resulted in an increased sensitivity to increments in concentration of dye.
FIG. 10
FIG. 10
Upper panels: effect of background dye on the calibration curves for indocyanine green in blood in a monochromatic densitometer (D1) and a polychromatic densitometer (D2U). Lower panels: effect of appropriate zero suppression on compensation for background dye. The degree of zero suppression is defined as the ratio of a to d0 in which d0 is the galvanometer deflection produced by changing the phototube illumination from zero to that transmitted through un-dyed “blank” blood and a is the deflection from zero illumination to the mechanical zero position of the galvanometer. See text and Fig. 13 for additional details.
FIG. 11
FIG. 11
Arithmetic and semi-logarithmic plots of calibration curves of densitometer D1 for India ink in water in the presence of different amounts of background India ink. One concentration unit of India ink was the concentration of a 1:500 dilution of the stock suspension of Higgins’ India ink. In the initial run, a concentration of 1 unit was used as the blank and increments were of 1 unit of concentration. In subsequent runs, concentrations of 2, 3, and more units were used as the blank. No zero-suppression voltage was employed (galvanometer-zero and zero-light positions coincided). Within limits of experimental error, the compensation for background India ink was perfect, there being no change in the sensitivity to cor-responding increments in concentration. This excellent compensation was expected since the plot of the logarithm of the transmission versus the concentration was a straight line (right panel) indicating conformance to Beer’s law.
FIG. 12
FIG. 12
Theoretical effect on calibration curves when sensitivity of densitometer is adjusted to the same scale reading by resetting on a blank containing some of the test substance. Left panel illustrates the situation occurring when calibration of densitometer for the test substance fits Beer’s law. With some background concentration of the test substance (10 mg/liter in the illustration) as a blank, the galvanometer deflection was reset by multiplication of the sensitivity by a factor, S. This produces a parallel straight line originating at 10 mg/liter = 100% transmission, which, when considered as the origin (by shifting line to the left as indicated by arrows), is identical to the original calibration. Such a situation is illustrated experimentally in Fig. 11 for india ink in water. Right panel illustrates the situation expected when the calibration for the test substance in a given instrument does not comply with Beer’s law. Multiplication of each reading on the ordinate by a factor, S, produces a calibration curve originating at 10 mg/liter. However, this curve is no longer parallel, as is seen when the origin is shifted to the left to coincide with the original origin. This is the situation occurring with indocyanine green in whole blood; experimental observations are illustrated by Fig. 10.
FIG. 13
FIG. 13
Arithmetic and semilogarithmic plots of the calibration curve of densitometer D1 for indocyanine green in whole blood. Left panel shows the calibration curve approaching asymptotically a line a divisions (a = 7.5) above the zero-light position. Right panel shows that the semilogarithmic plot of the deflection d from zero light versus concentration is curved, thus deviating from Beer’s law. The plot of log (da) produces the desired straight line. This plot was attained by using various values of a until a straight-line relationship was found. Here, a = 7.5%, which is the amount of zero suppression which should be used so that the calibration curve will remain constant when the sensitivity of the instrument is adjusted on blank blood containing background dye by increasing the sensitivity potentiometer (H, Fig. 3) to the point that the identical deflection is obtained as on the original blank blood which contained no background dye (100% transmission). In this situation, the calibration curve approaches exponentially an asymptote coinciding with the galvanometer-zero position. Therefore, if all measurements of deflections are made from the galvanometer-zero position, the calibration will have an exponential (Beer’s law) relationship (the logarithm of the galvanometer deflection will be related linearly to the concentration of indocyanine green).

References

    1. Bassingthwaighte JB, Edwards AWT, Wood EH. J Appl Physiol. 1962;17:91. - PubMed
    1. Dow P. Physiol Rev. 1956;36:77. - PubMed
    1. Edwards AWT, Bassingthwaighte JB, Sutterer WF, Wood EH. Proc Staff Meetings Mayo Clinic. 1960;35:745. - PMC - PubMed
    1. Edwards AWT, Korner PI. Clin Sci. 1958;17:265. - PubMed
    1. Fox IJ, Sutterer WF, Wood EH. J Appl Physiol. 1957;11:390. - PubMed

Substances

LinkOut - more resources