. 1964 Mar:19:347-53.
doi: 10.1152/jappl.1964.19.2.347.

USE OF AN OPTICAL DENSITY RULER IN MEASUREMENTS OF DYE-DILUTION CURVES

USE OF AN OPTICAL DENSITY RULER IN MEASUREMENTS OF DYE-DILUTION CURVES

J B BASSINGTHWAIGHTE et al. J Appl Physiol. 1964 Mar.

Abstract

The inapplicability of Beer’s law to densitometry of dyes in whole blood or other nonhomogeneous media has been long known. When using a densitometer whose output is directly proportional to the light transmitted, a simple transformation— log X = log (xx0)—can be employed to allow rapid, accurate estimation of dye concentration. This is facilitated by use of an optical density ruler. The transformation, X = xx0, can be made mechanically, by shifting the infinity position of the ruler with reference to the zero light transmission position, or electrically, by appropriate use of zero suppression in the densitometer circuit. The transformation results in an exponential (logarithmic) relationship between light transmitted and concentration of the dye (indocyanine green). Readings of relative optical density obtained by use of the ruler are multiplied by a calibration constant to calculate dye concentration. The principles of the transformation have been applied to the determination of the optimal zero suppression required for maintenance of constant sensitivity of the densitometer in the presence of various levels of background dye.


Figures

FIG. 1
FIG. 1
Per cent transmission and optical density scales. Optical density = log10 (100/% light transmission). Thus, at 50% light transmission the OD = log10 (100/50) = log10 2 = .30; at 10% transmission, the OD = log10 (100/10) = 1 and at 1% transmission, the OD = log10 (100/1) = 2.
FIG. 2
FIG. 2
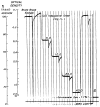
This photokymographic record of calibration dilutions of indocyanine green in whole blood is a segment of the recording providing the data of Figs. 3, 5, 6, and 7 and Table 1. Vertical lines show 10-sec intervals. With the infinity point of the optical density scale set at 10% of the distance from the zero light position to the blank setting, the “relative optical densities” (rcr0) are linearly proportional to the dye concentration, C; that is, the calibration constant, K, equals C/(rcr0) = 5/.155 = 10/.309 = 20/.619 = 32.4 (mg/liter)/OD unit.
FIG. 3
FIG. 3
Relative optical density readings (rcr0) on calibration curve of indocyanine green at various positions of the infinity point of the OD ruler. Data are from Fig. 2. With the infinity reading appropriately positioned (at 10% transmission in this case), the calibration factor is constant (the line is straight) and equals the reciprocal of the slope. Vertical displacement of the infinity point of the ruler upward or downward from the 10% transmission reading resulted in nonlinear calibration curves. Small displacements (for example, moving the infinity point to 7.7% transmission) result in curves that can be approximated quite well by a straight line.
FIG. 4
FIG. 4
Indicator-dilution curve recorded by sampling from the aortic root of a dog after the injection of indocyanine green dye into the pulmonary artery. Vertical lines show 1-sec intervals (equivalent to 2.5 cm on the recording). With the infinity position of the OD ruler at 7.7% light transmission, relative optical densities were read at 1-sec intervals and recorded in Table 2. This recording was made using a different densitometer from the one providing the recording shown in Fig. 2.
FIG. 5
FIG. 5
Optical density-concentration curves at each background dye level (B) were approximated by straight lines. These data were recorded with the densitometer zero suppression at 7.7% (optimal = 10%). The line labeled B = 0.0 is the line labeled 7.7% T in Fig. 3. The presence of increasing levels of background dye (2.5, 5.0, 7.5, and 10.0 mg/liter) resulted in a loss in sensitivity to increments in dye concentration—the slopes decreased and K increased as B was increased.
FIG. 6
FIG. 6
Relationship between the calibration constant (K) and the background dye concentration (B) with different levels of zero suppression. The values of K have been estimated by approximating with straight lines the calibration curves obtained from optical density readings made with the infinity point of the scale at the galvanometer zero setting. The solid lines have been fitted visually to the observations; the broken lines are members of the family K = m(B + 9.0) + 32.2, or K = mB + K0, where K0 = 32.2 + 9.0 m (these latter equations are marked with asterisks). They have a common point of intersection at B = − 9.0, K = 32.2.
Fig. 7
Fig. 7
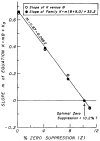
Influence of the degree of zero suppression (Z) on the slope (m) of the lines relating the calibration constant (K) to the level of background dye (B). The open circles represent the slopes (m) of the lines fitted visually to the data in Fig. 6; the closed circles represent the slopes of the lines of the theoretical family, K = m(B + 9.0) + 32.2. The change in sensitivity of the densitometer to increments in dye concentration at each degree of zero suppression is m/K0 per milligram of background dye per liter. When no zero suppression is used, the sensitivity loss for this instrument is 0.67/(32.2 + 9.0 × 0.67) = 1.7%/mg liter of background dye. At Z = 8%, the loss is 0.141/(32.2 + 9.0 × 0.141) = 0.4%/mg liter. Thus the sensitivity change is insignificant if the zero suppression is close to optimal.

References

    1. Bassingthwaighte JB, Edwards AWT, Wood EH. Areas of dye-dilution curves sampled simultaneously from central and peripheral sites. J Appl Physiol. 1962;17:91–98. - PubMed
    1. Edwards AWT, Bassingthwaighte JB, Sutterer WF, Wood EH. Blood level of indocyanine green in the dog during multiple dye curves and its effect on instrumental calibration. Proc Staff Meetings Mayo Clinic. 1960;35:745–751. - PMC - PubMed
    1. Edwards AWT, Isaacson J, Sutterer WF, Bassingthwaighte JB, Wood EH. Indocyanine green densitometry in flowing blood compensated for background dye. J Appl Physiol. 1963;18:1294–1304. - PMC - PubMed
    1. Gaddum JH. Lognormal distributions. Nature. 1945;156:463–466.
    1. Hamilton WF, Moore JW, Kinsman JM, Spurling RG. Studies on circulation: Further analysis of injection method, and of changes in hemodynamics under physiological and pathological conditions. Am J Physiol. 1932;99:534–551.

Substances

LinkOut - more resources