. 2003 Sep 19:4:22.
doi: 10.1186/1471-2202-4-22.

The BOLD response and the gamma oscillations respond differently than evoked potentials: an interleaved EEG-fMRI study

Affiliations

The BOLD response and the gamma oscillations respond differently than evoked potentials: an interleaved EEG-fMRI study

Jack R Foucher et al. BMC Neurosci. .

Abstract

Background: The integration of EEG and fMRI is attractive because of their complementary precision regarding time and space. But the relationship between the indirect hemodynamic fMRI signal and the more direct EEG signal is uncertain. Event-related EEG responses can be analyzed in two different ways, reflecting two different kinds of brain activity: evoked, i.e. phase-locked to the stimulus, such as evoked potentials, or induced, i.e. non phase-locked to the stimulus such as event-related oscillations. In order to determine which kind of EEG activity was more closely related with fMRI, EEG and fMRI signals were acquired together, while subjects were presented with two kinds of rare events intermingled with frequent distractors. Target events had to be signaled by pressing a button and Novel events had to be ignored.

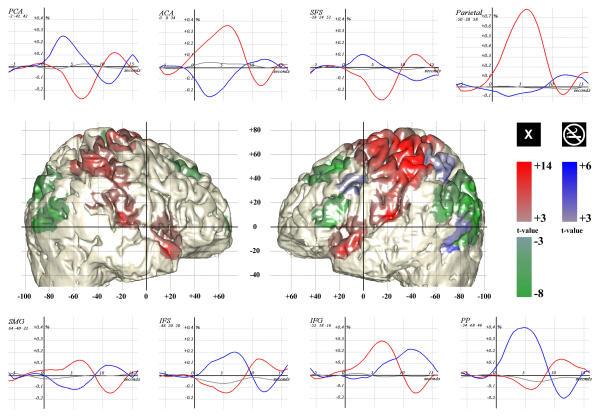
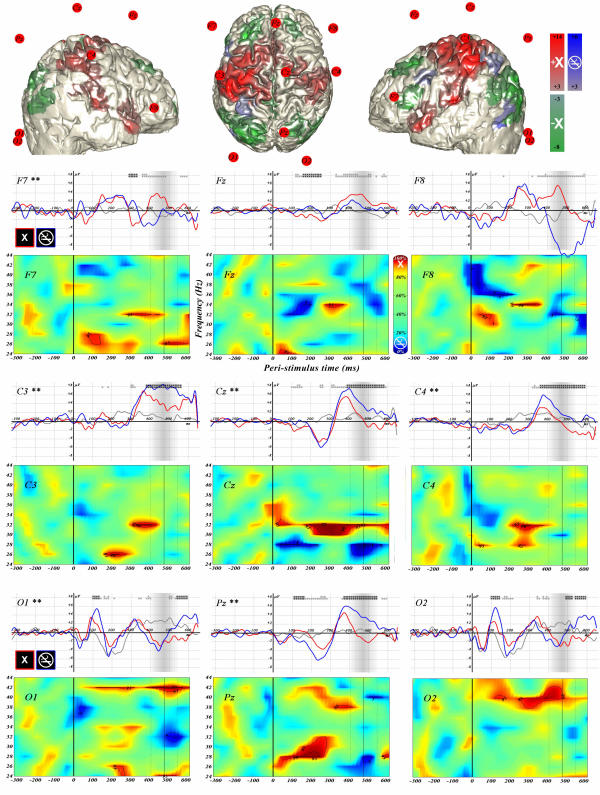
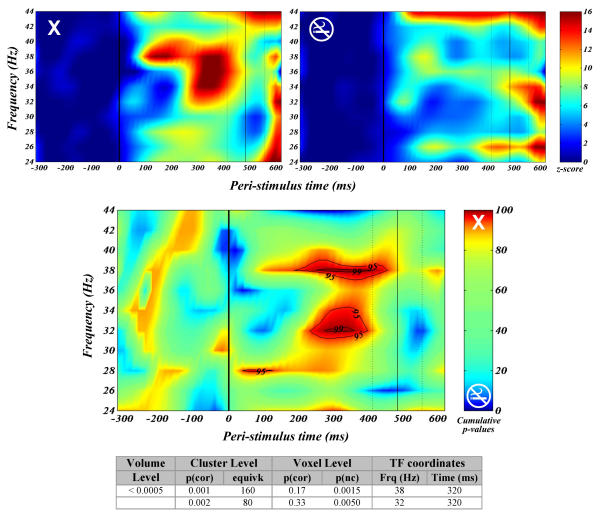
Results: Both Targets and Novels triggered a P300, of larger amplitude in the Novel condition. On the opposite, the fMRI BOLD response was stronger in the Target condition. EEG event-related oscillations in the gamma band (32-38 Hz) reacted in a way similar to the BOLD response.

Conclusions: The reasons for such opposite differential reactivity between oscillations / fMRI on the one hand, and evoked potentials on the other, are discussed in the paper. Those results provide further arguments for a closer relationship between fast oscillations and the BOLD signal, than between evoked potentials and the BOLD signal.


Figures

Figure 1
Figure 1
fMRI results Lateral views of the normalized brain of 1 subject, colored as a function of contrast: Target-related activation (red and "X" marks), Target-related deactivation (green and "no-smoking" marks), and Novel-related activation (blue) (thresholds p ≤ 0.001, 100 voxel). The network that deactivated on target presentation comprised the superior frontal sulcus (SFS), the parietal cortex and the inferior frontal sulcus (IFS). The latter is supposed to be related with distractor inhibition since its posterior part is over-activated by Novels together with the posterior parietal cortex (PP). The network activated by targets comprised the supra-marginal gyrus (SMG) and the inferior frontal gyrus (IFG). Note that the TPJ is composed of the SMG (BA 40) in its upper part, and of the superior temporal gyrus (BA 39) in its lower part. The peristimulus BOLD signals are displayed for each relevant region for Targets (red), Novels (blue) and frequent distractors (gray). The curves are computed by simple averaging after regressing the other condition effect and removing high- and low-frequency components. The variation in signal intensity is indicated as a percentage of the MRI signal, and the scale is similar for all except the parietal area. Notice the balance between the anterior cingulate area (ACA) and the posterior cingulate area (PCA). Those charts also exclude the possibility for a threshold effect to account for the absence of Novel-related activation of the EXO network.
Figure 2
Figure 2
Evoked potentials and event-related oscillations for each electrode and for all the subjects. The upper part presents three different views of the average electrode position relative to the areas with BOLD activation (threshold p ≤ 0.001, 100 voxels, Target-related activation – red, Target-related deactivation – green, and rare Distractor (Novel) activation – blue). It is provided for better appreciation of electrical signals, considering fMRI activation. The lower part displays the evoked potentials (EPs) and event-related oscillations (EROs) for each electrode, for the 5 subjects. For C3, Cz, C4, Pz, the "no-smoking" symbol, which is an instance of Novels (blue), yielded larger EPs than Targets (red). Distractors are represented in gray. For all the electrodes, the reverse is true as far as EROs are concerned, with significantly more oscillations around 300–400 ms, regarding Targets. In the case of EPs, signals have been plotted from -325 to +625 ms and the voltage range was kept constant from -9 to +9 μV. The shaded region around 474 ms corresponds to the response time and its standard deviation. The statistics for the comparison of Target-related and Novel-related EPs are computed every 10 ms, between 100 ms and 600 ms, and represented by the gray and black stars above the curves (1 star for pnc ≤ 0.05, 2 starsfor pnc ≤ 0.01). The time-cluster significance, corrected for multiple comparison is indicated by the color of the stars: black if above pc ≤ 0.05, gray if not significant at the corrected time-clusterlevel. The set level is given for each electrode by the number of stars beside the electrode label (1 star for p ≤ 0.05, 2 stars for p ≤ 0.01). For EROs, only the statistics comparing Targets and Novels is given for the 24- to 44-Hz band, and between -320 to 600 ms. The solid and dotted black lines correspond to the response time and standard deviation, respectively. The color code for the statistics is shown on the upper right hand side, and represents the cumulative p distribution stated in percent. Cold colors code for a higher Novel-related power level, and hot colors code for greater Target-related power intensity. Regions above the .05 and .01 thresholds are contoured in black (notice that the numbers 1, 5, 95 and 99 represent the cumulative p values stated in percent).
Figure 3
Figure 3
Event-related oscillations for all the electrodes. The upper part presents the event-related oscillations (EROs) time-frequency chart for Targets on the left (X-mark), and rare distractors (Novels) on the right ("no-smoking" symbol). It is shown for the 24- to 44-Hz band, and between -320 to 600 ms, summing up all 9 electrodes for all the subjects. The color scale represents the relative amount of power in standard deviation (reference period from -320 to 0 ms). This illustrates that the 32- to 38-Hz EROs in response to Targets are quite low in response to Novels. It thus does not come as a surprise that the statistical comparison of Target-related vs. Novel-related power for all electrodes is significant (lower time-frequency chart). Cold colors code for a trend towards greater power in the Novel condition, whereas hot colors represent greater power level in the Target condition. The scale represents the cumulative p distribution stated in percent. Regions above the .05 and .01 threshold are contoured in black. The numbers 1, 5, 95 and 99 represent the cumulative p value in percent, respectively equivalent to.01, .05 for Novels and .05, .01 for Targets. The solid and dotted black lines correspond to the response time and standard deviation, respectively. The result table provides the statistics for the time interval from 200 to 500 ms, and from 24 to 44 Hz, using a threshold p ≤ 0.01. Volume and time-frequency cluster p values are given corrected for multiple comparisons. Note that the ensemble statistics represent the probability to have the given amount of time-frequency points above the threshold (12 over 165 time-frequency points), and not the number of clusters as in EPs or fMRI. At the same threshold, there were no significantly larger power emissions in the Novel than in the Target condition (not even at the .05 threshold).

References

    1. Aine CJ. A conceptual overview and critique of functional neuroimaging techniques in humans: I. MRI/FMRI and PET. Crit Rev Neurobiol. 1995;9:229–309. - PubMed
    1. Mathiesen C, Caesar K, Akgoren N, Lauritzen M. Modification of activity-dependent increases of cerebral blood flow by excitatory synaptic activity and spikes in rat cerebellar cortex. J Physiol. 1998;512:555–566. - PMC - PubMed
    1. Mathiesen C, Caesar K, Lauritzen M. Temporal coupling between neuronal activity and blood flow in rat cerebellar cortex as indicated by field potential analysis. J Physiol. 2000;523:235–246. - PMC - PubMed
    1. Matsuura T, Kanno I. Quantitative and temporal relationship between local cerebral blood flow and neuronal activation induced by somatosensory stimulation in rats. Neurosci Res. 2001;40:281–290. - PubMed
    1. Logothetis NK, Pauls J, Augath M, Trinath T, Oeltermann A. Neurophysiological investigation of the basis of the fMRI signal. Nature. 2001;412:150–157. - PubMed

Publication types