. 2003 Oct;71(10):6083-7.
doi: 10.1128/IAI.71.10.6083-6087.2003.

Analysis of expression profile of mammalian cell entry (mce) operons of Mycobacterium tuberculosis

Affiliations

Analysis of expression profile of mammalian cell entry (mce) operons of Mycobacterium tuberculosis

Ashwani Kumar et al. Infect Immun. 2003 Oct.

Abstract

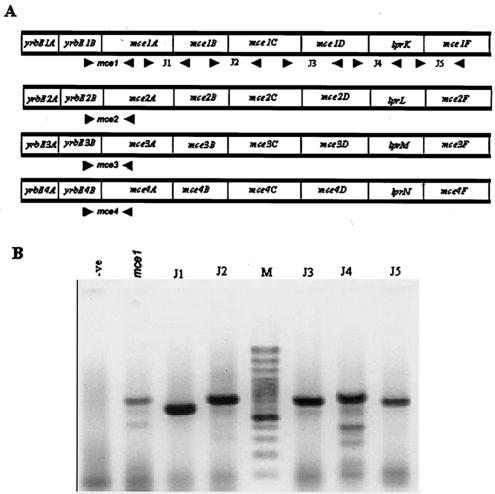
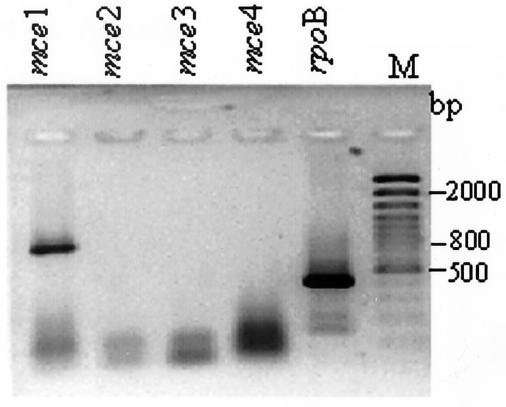
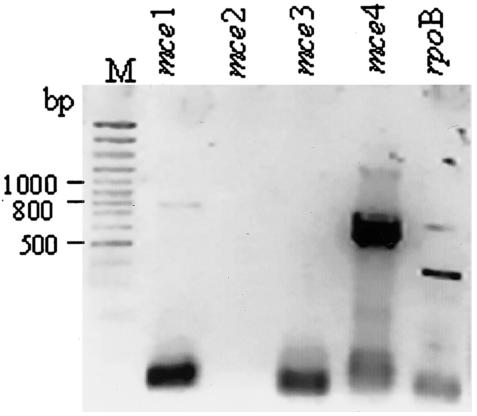
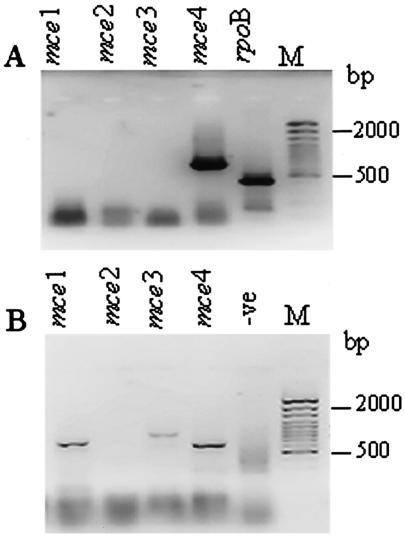
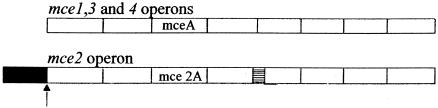
The sequencing of the complete genome of M. tuberculosis H37Rv has resulted in the recognition of four mce operons in its genome by in silico analysis. In an attempt to understand the significance of the redundancy of mce operons, we analyzed the expression profile of mce operons after different periods of growth in culture as well as during in vivo infection. Our results strongly suggest that mce1 is expressed as a polycistronic message. In culture from day 8 to day 12, expression of only mce1 was observed, but as the cultures progress towards stationary phase the expression profile of mce operons was altered; the transcripts of the mce1 operon were barely detected while those of the mce4 operon were prominent. In an analysis of the expression of mce operons in tubercle material collected from infected animal tissues, we detected the expression of mce1, -3 and -4. Our results imply that mce operons other than mce1 are also expressed during infection and that it is necessary to examine their role in pathogenesis.


Figures

FIG. 1.
FIG. 1.
Analysis of the expression of mce1 genes. (A) Schematic representation of the mce operons. The arrowheads indicate the position of the junction primers (J1 to J5). (B) Amplicons of RT-PCR with junction primers. Primer sets used are indicated above each lane. M, 100-bp ladder as a size marker; -ve, negative control, where mce1 primers were used in a PCR without an RT step. The RNA concentration was 300 ng per 20 μl of reaction mixture. The fast-moving band has the primer dimers.
FIG. 2.
FIG. 2.
Analysis of expression profile of mce operons in exponential phase. Amplicons of RT-PCR with specific primers for mce1, mce2, mce3, and mce4 and RNA from 10-day-old cultures as the template were analyzed by electrophoresis; the operon-specific primers used are indicated above the lanes. M, 100-bp ladder. Equal concentrations of RNA (500 ng per 20 μl of reaction mixture) were used in all experiments; rpoB was used as a positive control. The fast-moving band has the primer dimers.
FIG. 3.
FIG. 3.
Analysis of expression profile of mce operons in stationary phase. Amplicons of RT-PCR with operon-specific primers as indicated above each lane were analyzed; rpoB was used as a positive control. M, 100-bp ladder. The RNA from 20-day-old cultures was used at a concentration of 500 ng per 20 μl of reaction mixture. The fast-moving band has the primer dimers.
FIG. 4.
FIG. 4.
Analysis of expression profile of mce operons in bacilli from spleens of infected guinea pigs (A) and from pulmonary tubercles from infected rabbits (B). The amplicons are from RT-PCR with operon-specific primers as indicated above each lane; rpoB-specific primers were used as a positive control. M, 100-bp ladder; -ve, negative control, where the RT step was omitted for rpoB-specific primers to rule out DNA contamination. The RNA concentration was 300 ng per 20 μl of reaction mixture in each case. The fast-moving band has the primer dimers.
FIG. 5.
FIG. 5.
Analysis of expression profile at exponential growth phase (A) and stationary growth phase (B), analyzed by RT-PCR with gene-specific primers for 10 genes reported to be expressed in infected macrophages. The gene amplified is indicated above each lane. M, 100-bp marker. The RNA concentration was 300 ng per 20 μl of reaction mixture in each case. mce1 was used as a positive control (A). The fast-moving band has the primer dimers.
FIG. 6.
FIG. 6.
Schematic representation of the organization of mce2 and mce1, -3, and -4. Each open rectangle indicates a gene within the operon. Hatched rectangle, Rv0590A; filled rectangle, Rv0586 (encoding a putative lactate dehydrogenase regulator); arrow, putative start site of transcription of the first gene of the mce operon.

References

    1. Arruda, S., G. Bomfim, R. Knights, Huima-Byron, and L. W. Riley. 1993. Cloning of an M. tuberculosis DNA fragment associated with entry and survival inside cells. Science 261:1454-1457. - PubMed
    1. Chitale, S., S. Ehrt, S. Kawamura, T. Fujimura, N. Shimono, N. Anand, S. Lu, L. Cohen-Gould, and L. W. Riley. 2001. Recombinant Mycobacterium tuberculosis protein associated with mammalian cell entry. Cell. Microbiol. 3:247-254. - PubMed
    1. Cole, S. T., R. Brosch, J. Parkhill, T. Garnier, C. Churcher, S. V. Harris, et al. 1998. Deciphering the biology of Mycobacterium tuberculosis from the complete genome sequence. Nature 393:537-544. - PubMed
    1. Gonzalez, J. A., Y. Merchand, M. J. Colston, and R. A. Cox. 1999. Effects of growth conditions on expression of mycobacterial murA and tyrS genes and contributions of their transcripts to precursor rRNA synthesis. J. Bacteriol. 181:4617-4627. - PMC - PubMed
    1. Graham, J. E., and J. E. Clark-Curtiss. 1999. Identification of Mycobacterium tuberculosis RNAs synthesized in response to phagocytosis by human macrophages by selective capture of transcribed sequences (SCOTS). Proc. Natl. Acad. Sci. USA 96:11554-11559. - PMC - PubMed

Publication types

LinkOut - more resources