. 2003 Oct 1;31(19):5513-25.
doi: 10.1093/nar/gkg776.

GLIS3, a novel member of the GLIS subfamily of Krüppel-like zinc finger proteins with repressor and activation functions

Affiliations

GLIS3, a novel member of the GLIS subfamily of Krüppel-like zinc finger proteins with repressor and activation functions

Yong-Sik Kim et al. Nucleic Acids Res. .

Abstract

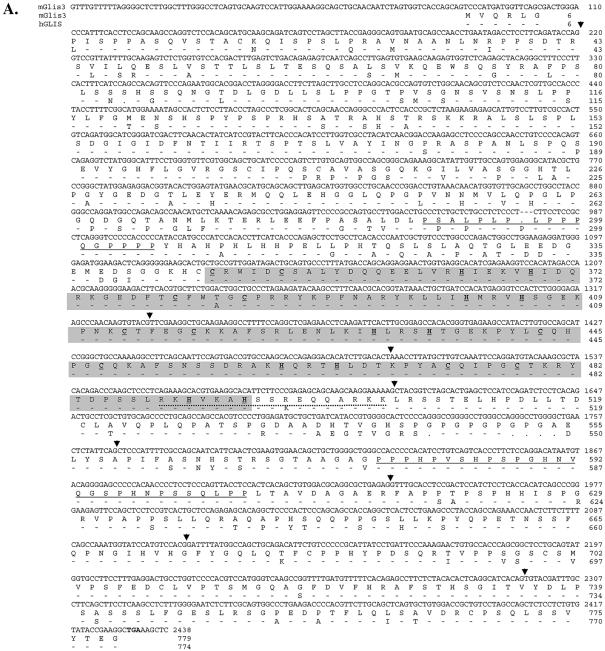
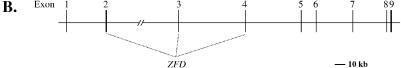
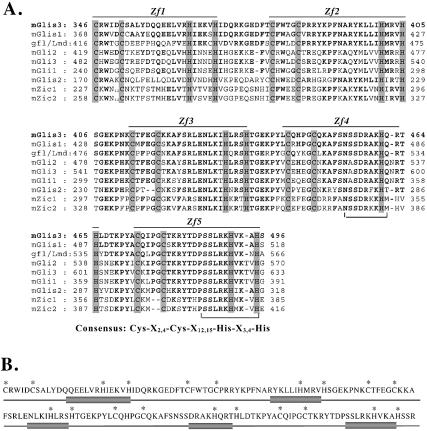
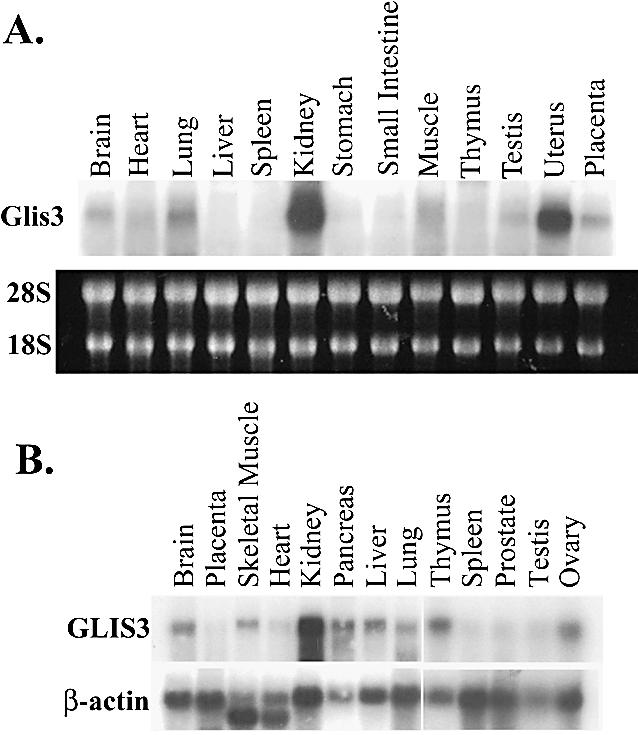
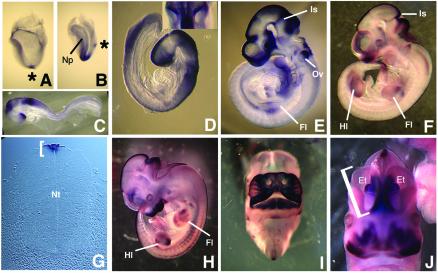
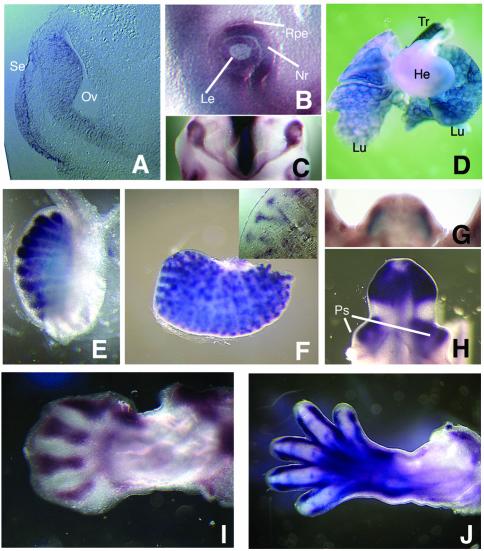
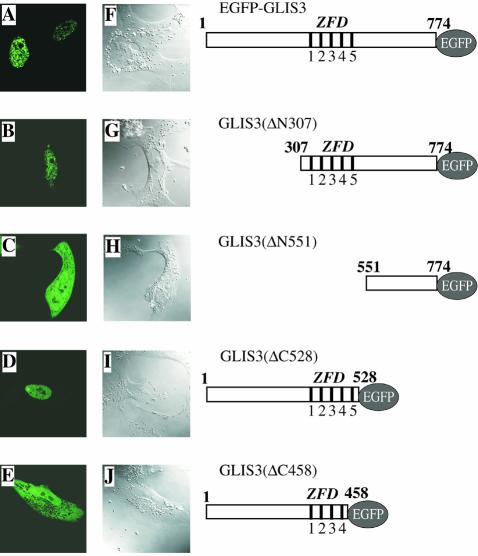
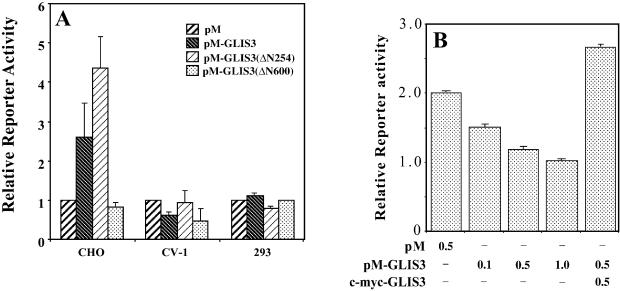
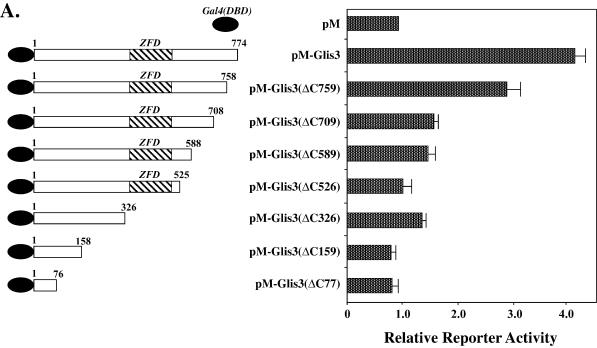
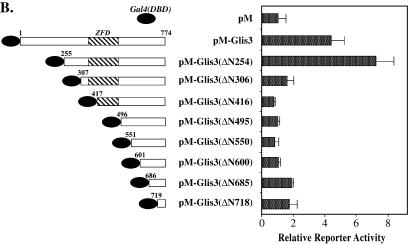
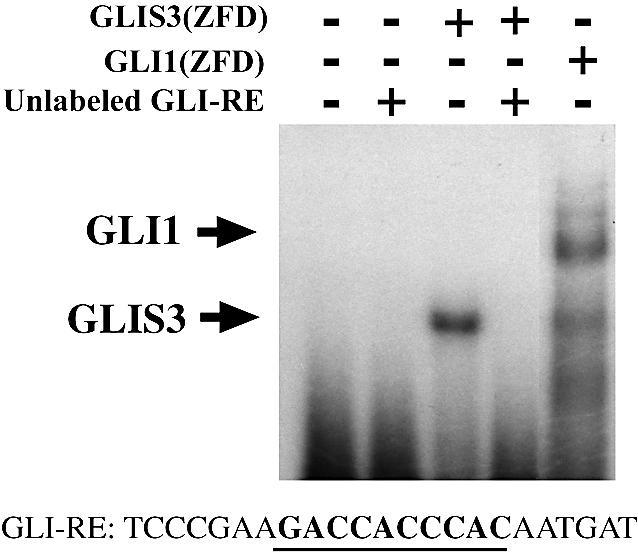
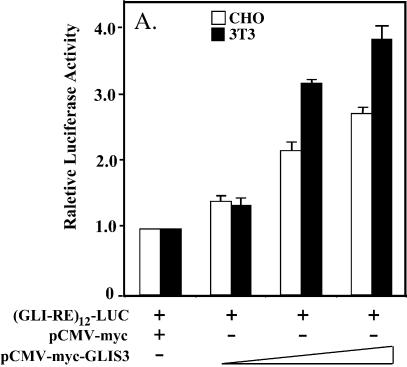
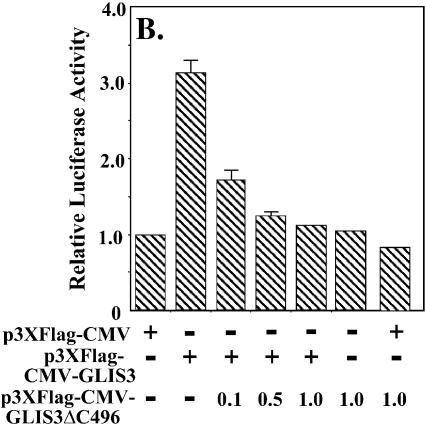
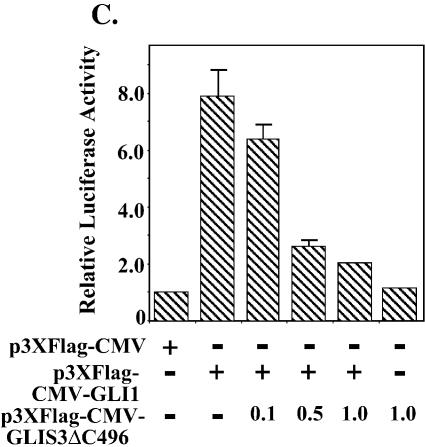
In this study, we describe the identification and characterization of a novel transcription factor GLI-similar 3 (GLIS3). GLIS3 is an 83.8 kDa nuclear protein containing five C2H2-type Krüppel-like zinc finger motifs that exhibit 93% identity with those of GLIS1, however, little homology exists outside their zinc finger domains. GLIS3 can function as a repressor and activator of transcription. Deletion mutant analysis determined that the N- and C-termini are required for optimal transcriptional activity. GLIS3 binds to the GLI-RE consensus sequence and is able to enhance GLI-RE-dependent transcription. GLIS3(DeltaC496), a dominant-negative mutant, inhibits transcriptional activation by GLIS3 and GLI1. Whole mount in situ hybridization on mouse embryos from stage E6.5 through E14.5 demonstrated that GLIS3 is expressed in specific regions in developing kidney and testis and in a highly dynamic pattern during neurulation. From E11.5 through E12.5 GLIS3 was strongly expressed in the interdigital regions, which are fated to undergo apoptosis. The temporal and spatial pattern of GLIS3 expression observed during embryonic development suggests that it may play a critical role in the regulation of a variety of cellular processes during development. Both the repressor and activation functions of GLIS3 may be involved in this control.


Figures

Figure 1
Figure 1
(A) The nucleotide and amino acid sequences of mouse GLIS3. The nucleotide and deduced amino acid sequences of mouse GLIS3 are shown in the first and second lines, respectively. The third line shows the amino acid sequence of human GLIS3. . indicates a gap; – indicates an amino acid conserved with mGLIS3. The start and stop codons are indicated in bold. The two proline-rich regions are underlined. The ZFD is shaded. The Cys and His residues involved in the tetrahedral configuration in the zinc finger motifs are underlined and in bold. The putative bipartite NLS is indicated by a dotted line. The GLIS3 sequence was submitted to GenBank under accession no. AY220846. (B) Schematic presentation of the genomic structure of GLIS3. The locations of the intron–exon junctions are indicated by arrowheads in (A). Bar indicates 10 kb.
Figure 1
Figure 1
(A) The nucleotide and amino acid sequences of mouse GLIS3. The nucleotide and deduced amino acid sequences of mouse GLIS3 are shown in the first and second lines, respectively. The third line shows the amino acid sequence of human GLIS3. . indicates a gap; – indicates an amino acid conserved with mGLIS3. The start and stop codons are indicated in bold. The two proline-rich regions are underlined. The ZFD is shaded. The Cys and His residues involved in the tetrahedral configuration in the zinc finger motifs are underlined and in bold. The putative bipartite NLS is indicated by a dotted line. The GLIS3 sequence was submitted to GenBank under accession no. AY220846. (B) Schematic presentation of the genomic structure of GLIS3. The locations of the intron–exon junctions are indicated by arrowheads in (A). Bar indicates 10 kb.
Figure 2
Figure 2
(A) Amino acid sequence alignment of the ZFD of mouse GLIS3 with those of GLIS1, gfl/lmd, GLI2, GLI3, GLI1, GLIS2, ZIC1 and ZIC2. Zf1–Zf5 indicate the five zinc finger motifs. Bold residues indicate amino acids conserved with mGLIS3. The Cys and His residues conserved in the zinc finger motifs are shaded. The consensus sequence of the zinc finger motifs is shown at the bottom. The amino acids between brackets indicate regions in the fourth and fifth zinc fingers involved in making DNA contacts. (B) Localization of α-helices in the ZFD of mGLIS3 as determined by GOR3 secondary structure prediction analysis. Bars indicate α-helix. The asterisks indicate the Cys and His residues involved in the tetrahedral configuration in the zinc finger motifs. (C) Schematic comparison of murine GLIS3, GLIS1, GLI1-3, GLIS2, ZIC1 and ZIC2 and Drosophila gfl/lmd. The percent identity of the ZFDs with mGLIS3 ZFD is indicated. Little homology was observed in the regions outside the ZFD. (D) Evolutionary relationship between the ZFDs of GLIS, GLI and ZIC proteins and their Drosophila homologs gfl/lmd, Ci and Opa. The phylogenetic tree was derived using the neighbor joining tree construction and Jukes–Cantor distance correction methods.
Figure 2
Figure 2
(A) Amino acid sequence alignment of the ZFD of mouse GLIS3 with those of GLIS1, gfl/lmd, GLI2, GLI3, GLI1, GLIS2, ZIC1 and ZIC2. Zf1–Zf5 indicate the five zinc finger motifs. Bold residues indicate amino acids conserved with mGLIS3. The Cys and His residues conserved in the zinc finger motifs are shaded. The consensus sequence of the zinc finger motifs is shown at the bottom. The amino acids between brackets indicate regions in the fourth and fifth zinc fingers involved in making DNA contacts. (B) Localization of α-helices in the ZFD of mGLIS3 as determined by GOR3 secondary structure prediction analysis. Bars indicate α-helix. The asterisks indicate the Cys and His residues involved in the tetrahedral configuration in the zinc finger motifs. (C) Schematic comparison of murine GLIS3, GLIS1, GLI1-3, GLIS2, ZIC1 and ZIC2 and Drosophila gfl/lmd. The percent identity of the ZFDs with mGLIS3 ZFD is indicated. Little homology was observed in the regions outside the ZFD. (D) Evolutionary relationship between the ZFDs of GLIS, GLI and ZIC proteins and their Drosophila homologs gfl/lmd, Ci and Opa. The phylogenetic tree was derived using the neighbor joining tree construction and Jukes–Cantor distance correction methods.
Figure 3
Figure 3
Tissue-specific expression of GLIS3. Total RNA isolated from placenta and various adult tissues was examined by northern blot analysis. (A) Mouse; (B) human. Blots were hybridized to a 32P-labeled probe for GLIS3 or β-actin as described in Materials and Methods. In (A) the pattern of 18–28S rRNA is shown to demonstrate equal loading of RNA samples.
Figure 4
Figure 4
Whole mount preparations demonstrating GLIS3 RNA localization during mouse development. (A) Expression in the node [asterisk in (A) and (B)] of ∼E8.0 embryo. (B) Expression in node and neural plate of ∼E8.25 embryo. (C) Lateral view of E8.5 embryo. (D) Lateral view of E8.75 embryo. (Inset) Dorsal view of embryo showing otic vesicles. (E) Lateral view of E9.5 embryo. Note expression in forelimb. (F) Lateral view of E10.5 embryo. (G) Transverse section through E11.5 neural tube illustrating GLIS3 expression in roof plate (bracket). (H) Lateral view of E11.5 embryo. (I) Frontal view of E12.5 day embryo illustrating facial GLIS3 expression. (J) Frontal view of E12.5 embryo illustrating GLIS3 expression in telencephalic vesicles (one of which is bracketed) and eminentia thalami. Abbreviations: Et, eminentia thalami; Hl, hindlimb; Fl, forelimb; Is, isthmus; Np, neural plate; Nt, neural tube; Ov, otic vesicle.
Figure 5
Figure 5
GLIS3 expression in specific embryonic organs and outgrowths. (A) Frontal section through E9.5 head demonstrating GLIS3 expression in optic vesicle and surface ectoderm. (B) Lateral view of E0.5 eye. (C) View of optic structures from the bottom of a E10.5 head demonstrating GLIS3 expression in the optic cups and nasal portion of the optic stalk. Anterior is down. (D) Lungs, heart and trachea of E4.5 embryo. (E) Testis of E14.5 embryo demonstrating GLIS3 expression in the seminiferous tubules. (F) Metanephros of E14.5 embryo. (Inset) Section of E14.5 metanephros demonstrating GLIS3 expression in the branches of the ureteric bud. (G) Genital tubercle of an E12.5 embryo viewed from the anterior perspective. (H) Genital tubercle of an E14.5 embryo viewed from the anterior perspective. (I) E12.5 forelimb, dorsal view with anterior aspect up. (J) E14.5 forelimb, dorsal view with anterior aspect up. Abbreviations: He, heart; Le, lens; Lu, lung; Nr, neural retina; Oc, optic cup; Os, optic stalk; Ov, optic vesicle; Ps, preputial swelling; Rpe, retinal pigmented epithelium; Se, surface ectoderm; Tr, trachea.
Figure 6
Figure 6
GLIS3 localizes primarily to the nucleus. Plasmids pEGFP-GLIS3 (A and F), pEGFP-GLIS3(ΔN307) (B and G), pEGFP-GLIS3(ΔN551) (C and H), pEGFP-GLIS3(ΔC528) (D and I) or pEGFP-GLIS3(ΔC458) (E and J) were transfected into CV-1 cells and after 30 h the cellular localization of EGFP–GLIS3 fusion proteins examined by fluorescence confocal microscopy as described in Materials and Methods (A–E). EGFP was equally divided between cytoplasm and nucleus (not shown). 1–5 indicate the five zinc finger motifs. (F)–(J) Confocal images.
Figure 7
Figure 7
GLIS3 is able to function as a transcriptional repressor and activator. (A) (UAS)5-LUC, pCMVβ and pM-GLIS3 plasmid DNAs were co-transfected into CV-1, CHO and 293 cells. After 30 h, cells were assayed for luciferase (LUC) and β-galactosidase activity as described in Materials and Methods. The relative LUC reporter activity was calculated and plotted. (B) Repression of basal transcription by Gal4(DBD)–GLIS3 and its reversal by GLIS3. CV-1 cells were co-transfected with (UAS)5-LUC, pCMVβ and pM or different amounts of pM-GLIS3 in the presence or absence of pCMV-mycGLIS3 expression plasmid as indicated. Reporter activity was measured 30 h later.
Figure 8
Figure 8
Effect of various N- and C-terminal deletions on the transcriptional activity of GLIS3. CHO cells were co-transfected with (UAS)5-LUC, pCMVβ and pM or pM-GLIS3 containing various C- (A) or N-terminal (B) deletions in GLIS3 as indicated. Forty-eight hours after transfection, cells were assayed for LUC and β-galactosidase activity as described in Materials and Methods. The relative LUC activity was calculated and plotted.
Figure 8
Figure 8
Effect of various N- and C-terminal deletions on the transcriptional activity of GLIS3. CHO cells were co-transfected with (UAS)5-LUC, pCMVβ and pM or pM-GLIS3 containing various C- (A) or N-terminal (B) deletions in GLIS3 as indicated. Forty-eight hours after transfection, cells were assayed for LUC and β-galactosidase activity as described in Materials and Methods. The relative LUC activity was calculated and plotted.
Figure 9
Figure 9
GLIS3 is able to bind the consensus GLI response element (GLI-RE). Electrophoretic mobility shift assay was performed with (His)6-GLIS3(ZFD) or (His)6-GLI1(ZFD) fusion proteins using a 32P-labeled oligonucleotide containing the consensus GLI-RE. The sequence of the GLI-RE is shown at the bottom; the consensus core motif is indicated in bold. The positions of the shifted protein–DNA complexes are indicated by arrows. Unlabeled GLI-RE (100× excess) competed with 32P-labeled GLI-RE for His6-GLIS3 binding (lane 4).
Figure 10
Figure 10
(A) Induction of GLI-RE-mediated transcriptional activation by GLIS3. CHO or NIH 3T3 cells were transfected with (GLI-RE)12-LUC and increasing amounts (0.1–1.0 µg) of p3×FlagCMV-GLIS3 expression vector as indicated. (B) Inhibition of GLIS3-induced transcription by dominant-negative GLIS3(ΔC496). CHO cells were transfected with (GLI-RE)12-LUC, p3×FlagCMV-GLIS3 and increasing amounts of the p3×FlagCMV-GLIS3(ΔC496) expression vector as indicated. (C) Inhibition of GLI1- induced transcription by GLIS3(ΔC496). CHO cells were transfected with (GLI-RE)12-LUC, p3×FlagCMV-GLI1 and increasing amounts of the p3×FlagCMV-GLIS3(ΔC496) expression vector as indicated. After 30 h, cells were analyzed for reporter activities. The relative LUC activity was calculated and plotted.
Figure 10
Figure 10
(A) Induction of GLI-RE-mediated transcriptional activation by GLIS3. CHO or NIH 3T3 cells were transfected with (GLI-RE)12-LUC and increasing amounts (0.1–1.0 µg) of p3×FlagCMV-GLIS3 expression vector as indicated. (B) Inhibition of GLIS3-induced transcription by dominant-negative GLIS3(ΔC496). CHO cells were transfected with (GLI-RE)12-LUC, p3×FlagCMV-GLIS3 and increasing amounts of the p3×FlagCMV-GLIS3(ΔC496) expression vector as indicated. (C) Inhibition of GLI1- induced transcription by GLIS3(ΔC496). CHO cells were transfected with (GLI-RE)12-LUC, p3×FlagCMV-GLI1 and increasing amounts of the p3×FlagCMV-GLIS3(ΔC496) expression vector as indicated. After 30 h, cells were analyzed for reporter activities. The relative LUC activity was calculated and plotted.

References

    1. Nagai T., Aruga,J., Takada,S., Gunther,T., Sporle,R., Schughart,K. and Mikoshiba,K. (1997) The expression of the mouse Zic1, Zic2 and Zic3 gene suggests an essential role for Zic genes in body pattern formation. Dev. Biol., 182, 299–313. - PubMed
    1. Walterhouse D.O., Yoon,J.W. and Iannaccone,P.M. (1999) Developmental pathways: Sonic hedgehog-Patched-GLI. Environ. Health Perspect., 107, 167–171. - PMC - PubMed
    1. Aruga J., Nagai,T., Tokuyama,T., Hayashizaki,Y., Okazaki,Y., Chapman,V.M. and Mikoshiba,K. (1996) The mouse zic gene family. Homologues of the Drosophila pair-rule gene odd-paired. J. Biol. Chem., 271, 1043–1047. - PubMed
    1. Kinzler K.W., Ruppert,J.M., Bigner,S.H. and Vogelstein,B. (1988) The GLI gene is a member of the Kruppel family of zinc finger proteins. Nature, 332, 371–374. - PubMed
    1. Villavicencio E.H., Walterhouse,D.O. and Iannaccone,P.M. (2000) The Sonic Hedgehog-Patched-Gli pathway in human development and disease. Am. J. Hum. Genet., 67, 1047–1054. - PMC - PubMed

MeSH terms

Associated data