

doi: 10.1093/nar/gng113.
A microarray-based high throughput molecular marker genotyping method: the tagged microarray marker (TAM) approach
Affiliations
- PMID: 14500843
- PMCID: PMC206481
- DOI: 10.1093/nar/gng113
Item in Clipboard
A microarray-based high throughput molecular marker genotyping method: the tagged microarray marker (TAM) approach
Nucleic Acids Res.
.
Abstract
A microarray-based method has been developed for scoring thousands of DNAs for a co-dominant molecular marker on a glass slide. The approach was developed to detect insertional polymorphism of transposons and works well with single nucleotide polymorphism (SNP) markers. Biotin- terminated allele-specific PCR products are spotted unpurified onto streptavidin-coated glass slides and visualised by hybridisation of fluorescent detector oligonucleotides to tags attached to the allele- specific PCR primers. Two tagged primer oligonucleotides are used per locus and each tag is detected by hybridisation to a concatameric DNA probe labelled with multiple fluorochromes.
Figures
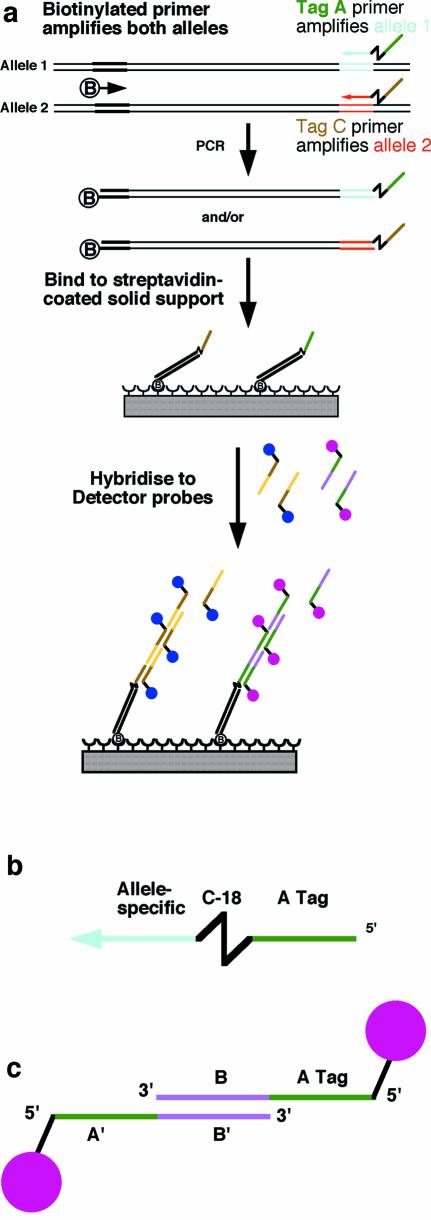
The tagged microarray approach. (a) Two alleles are distinguished by PCR using three primers. The biotinylated PCR products are arrayed onto a solid support and hybridised with detector probes, which recognise tags specific to the two products. (b) Structure of a tag primer. The allele-specific region is separated from the tag by a C18 linker. (c) Tag detector probe. Two partially complementary oligonucleotides carry a tag sequence (the A tag in this case), its reverse complement (A′), a region of cross-homology (B and B′ for this pair) and a fluorochrome each.
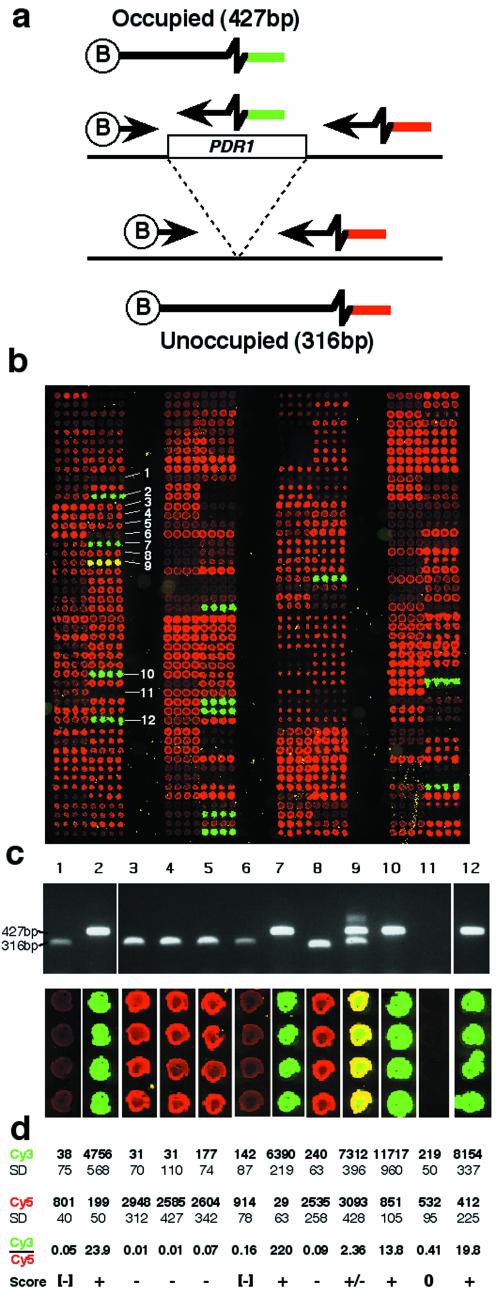
The tagged microarray approach applied to a pea genomic retrotransposon insertion. (a) The two alleles differ by the presence or absence of a retrotransposon insertion (PDR1 here). Different PCR products are produced from the two alleles and these can be recognised either by gel electrophoresis or the tagged microarray approach (Fig. 1). (b) Microarray image from 384 pea samples assayed for the 1794-1 allele. Each sample was spotted four times in a row. Cy3 fluorescing spots (green) represent the occupied site allele and Cy5 labelled spots (red) show the unoccupied site allele. Arrowed samples were analysed by gel electrophoresis (Fig. 1c). (c) Agarose gel of samples arrowed in (b), together with corresponding fluorescent images taken from the array image. (d) Quantitation of array spot intensities shown in (c). SD, standard deviation.
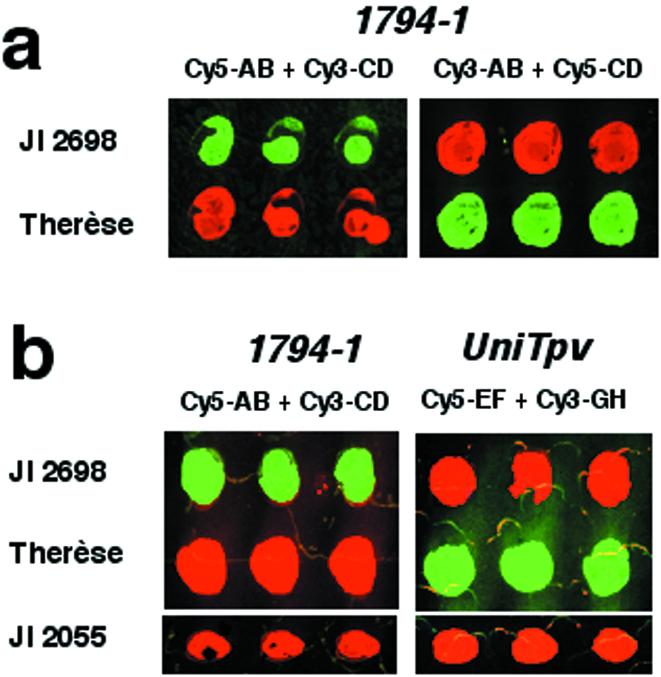
Modifications to the tagged microarray approach. (a) Using tag detectors labelled with different fluorochromes produces different fluorescent outputs from the same samples. Sample JI 2698 contains an occupied 1794-1 allele and sample Therèse is unoccupied. Samples were spotted in triplicate. (b) Using four tag detectors to analyse the allelic state for two loci in the same reaction. Sample JI 2698 is occupied for 1794-1 and unoccupied for UniTpv, sample Therèse is unoccupied for 1794-1 and occupied for UniTpv and sample JI 2055 is unoccupied for both loci. Tag detectors used for both loci produce Cy3 signal (green) from an occupied allele and Cy5 signal (red) from an unoccupied allele.
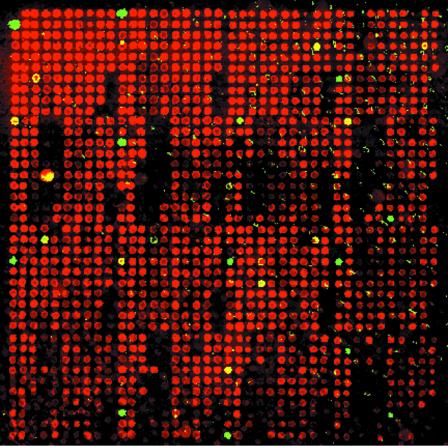
Microarray image for 1536 pea DNA samples assayed for the 1794-1 allele under the same conditions as Figure 2b. Red (Cy5) spots indicate samples containing an unoccupied (–) allele, green indicates occupied (+) and yellow indicates both alleles (+/–). Each PCR was spotted once per array.
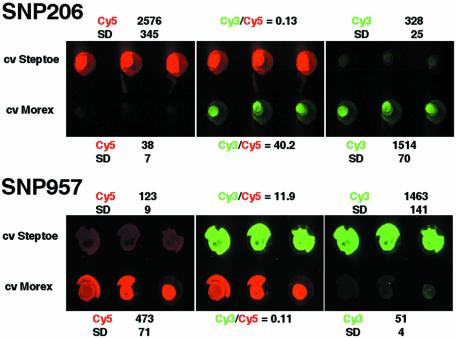
Detection of barley SNP polymorphisms using the tagged microarray approach. Cultivars Steptoe and Morex have contrasting alleles for SNP 206 and SNP 957. Cy5 fluorescence indicates the presence of one allele and Cy3 the other. Samples were spotted in triplicate. The Cy3 (green) and Cy5 (red) colour-separated images and the two-colour (overlay) image are shown. Quantification of averaged array intensities (in arbitrary fluorescence units) and the Cy3/Cy5 ratios of signal intensities are also shown. SD, standard deviation.
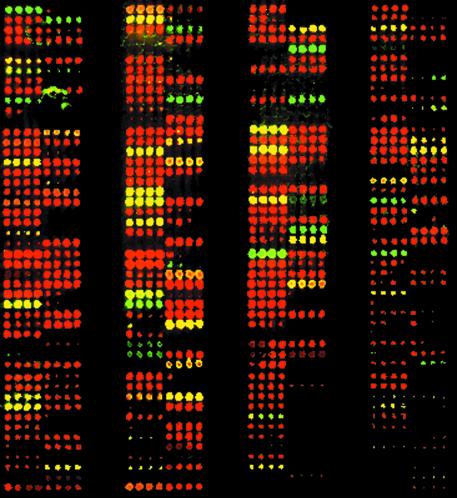
Microarray image for 384 barley DNA samples assayed for the SNP 206 allele. Reaction and detection conditions were the same as for Figure 5 and arraying format is the same as for Figure 2b. Each PCR was spotted four times per array.
References
-
- Jeffreys A., Wilson,V. and Thein,S.L. (1985) Hypervariable ‘minisatellite’ regions in human DNA. Nature, 314, 67–73. - PubMed
-
- Tsuchihashi Z. and Dracopoli,N.C. (2002) Progress in high throughput SNP genotyping methods. Pharmacogenomics J., 2, 103–110. - PubMed
-
- Schena M., Shalon,D., Davis,R.W. and Brown,P.O. (1995) Quantitative monitoring of gene expression patterns with a complementary DNA microarray. Science, 270, 467–470. - PubMed
