. 2003 Oct 1;31(19):e119.
doi: 10.1093/nar/gng120.

PNA microarrays for hybridisation of unlabelled DNA samples

Affiliations

PNA microarrays for hybridisation of unlabelled DNA samples

Ole Brandt et al. Nucleic Acids Res. .

Abstract

Several strategies have been developed for the production of peptide nucleic acid (PNA) microarrays by parallel probe synthesis and selective coupling of full-length molecules. Such microarrays were used for direct detection of the hybridisation of unlabelled DNA by time-of-flight secondary ion mass spectrometry. PNAs were synthesised by an automated process on filter-bottom microtitre plates. The resulting molecules were released from the solid support and attached without any purification to microarray surfaces via the terminal amino group itself or via modifications, which had been chemically introduced during synthesis. Thus, only full-length PNA oligomers were attached whereas truncated molecules, produced during synthesis because of incomplete condensation reactions, did not bind. Different surface chemistries and fitting modifications of the PNA terminus were tested. For an examination of coupling selectivity, bound PNAs were cleaved off microarray surfaces and analysed by MALDI-TOF mass spectrometry. Additionally, hybridisation experiments were performed to compare the attachment chemistries, with fully acetylated PNAs spotted as controls. Upon hybridisation of unlabelled DNA to such microarrays, binding events could be detected by visualisation of phosphates, which are an integral part of nucleic acids but missing entirely in PNA probes. Overall best results in terms of selectivity and sensitivity were obtained with thiol-modified PNAs on maleimide surfaces.


Figures

Figure 1
Figure 1
Influence of synthesis parameters on quality of the PNA H2N-TCGATCAGT-CONH2. (a) Two subsequent couplings of 10 min each were performed. There was one washing step after deprotection, one after coupling and two after capping. (b) Duration of the two coupling reactions was extended to 15 min and there were more washing steps: three after deprotection, one after coupling and again three after capping. (c) While coupling remained the same, the number of washing steps was increased to five after deprotection, three after coupling and six after capping.
Figure 2
Figure 2
Quality control of PNA synthesis. Mass spectra of oligomer Seq1-PNA with different N-terminal groups are shown, obtained by MALDI-TOF mass spectrometry directly after synthesis. From top to bottom, data are presented for acetylated Seq1-PNA ([M+H]+, m/z = 3877.7), the oligomer with an N-terminal cysteine ([M+H]+, m/z = 3938.9) and with a biotin modification ([M+H]+, m/z = 4062.0), respectively. Additionally, a mass spectrum for Li-Li-CCATACAAATTTCAGGATTT ([M+H]+, m/z = 5686.5) (Li is an AEEA-OH linker) is presented in the bottom panel as an example of the typical quality of a 20mer PNA.
Figure 3
Figure 3
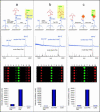
Selective binding of full-length PNA molecules. The chemistry that was applied, MALDI-TOF mass spectra of the molecules released from the microarray surface, hybridisation experiments and corresponding signal intensities are shown from top to bottom for the N-terminal (a), thiol-modified (b) and biotinylated PNAs (c). (Top) A scheme of the basic chemistry of attachment is presented. Cleavage releases the kind of molecule highlighted by a yellow background. The MALDI-TOF analyses (second panel) compare spectra of the crude Seq1-PNA resulting from synthesis (black lines) with spectra of the same molecule after spotting on a microarray surface and subsequent release (blue lines). The mass difference between the initial full-length PNA peak and the peak of the released molecule matches the mass of the remains of the linker system. The signal marked by an asterisk indicates non-specific interaction. (Third panel) Results obtained after the oligonucleotides DNA-Seq1-Cy5, DNA-Seq2G-Cy3 and DNA-TC-Cy5 were hybridised at saturating conditions. From left to right, fully acetylated Seq1-PNA (lane 1), crude Seq1-PNA (lane 2), buffer (lanes 3 and 4), acetylated Seq2C-PNA (lane 5), crude Seq2C-PNA (lane 6), buffer (lanes 7 and 8), acetylated TC-PNA (lane 9) and crude TC-PNA (lane 10) were spotted in several copies. (Fourth panel) The actual average signal intensities of the acetylated Seq2C-PNA, crude Seq2C-PNA and buffer spots are shown.
Figure 4
Figure 4
Determination of microarray surface loading capacities. Cy5- labelled DNA oligonucleotides were hybridised to microarrays, onto which complementary PNA oligomers had been spotted at concentrations ranging from 5 to 200 µM for DSC slides, 10 to 300 µM for EMCS slides and 5 to 300 µM for strepavidin-coated microarrays. The recorded signal intensities (DSC, black; EMCS, red; strepavidin, blue) indicate the relative binding capacities.
Figure 5
Figure 5
Detection of single base mismatches. The 13mer Seq2-PNA molecules (Table 1) were spotted on DSC-activated silicon wafers in two rows of eight replicate spots each, separated by two rows of buffer spots. The PNAs were identical in sequence but for the central base, which was (from top to bottom) A, C, G and T, respectively. Slides were hybridised with a mixture of two complementary oligonucleotides: (a) DNA-Seq2G-Cy3 and DNA-Seq2A-Cy5; (b) DNA-Seq2G-Cy3 and DNA-Seq2C-Cy5; (c) DNA-Seq2G-Cy3 and DNA-Seq2T-Cy5.
Figure 6
Figure 6
Detection of hybridisation of unlabelled DNA. (a) From left to right, the following molecules were spotted on maleimide silicon wafers, arranged in columns of 10 replicates each: Seq1-PNA, buffer, buffer, Seq2C-PNA, buffer, buffer, Seq3-PNA, buffer, buffer, TC-PNA. Hybridisation was either with a mixture of DNA-Seq1-Cy5, DNA-Seq2G-Cy3 and DNA-TC-Cy5 (right panel) or the corresponding, unlabelled 50mer oligonucleotides (Table 1) (left panel). The latter experiment was analysed by TOF-SIMS, the results of which are shown in a false colour representation. A short bar indicates the colour code for the signal intensities. (b) A dilution series of Seq1-PNA and TC-PNA was spotted left to right (400, 350, 300, 250, 200, 150, 100, 50, 25 and 12.5 fmol; spot diameter 300 µm) in columns of eight copies on a silicon wafer with a gold surface. Hybridisation was with an unlabelled oligonucleotide that was complementary to TC-PNA and analysis by TOF-SIMS. The signal intensities determined at a mass of 79 Da (PO3) are presented.

References

    1. Schena M., Shalon,D., Davis,R.W. and Brown,P.O. (1995) Quantitative monitoring of gene expression patterns with a complementary DNA microarray. Science, 270, 467–470. - PubMed
    1. Guo Z., Guilfoyle,R.A., Thiel,A.J., Wang,R. and Smith,L.M. (1994) Direct fluorescence analysis of genetic polymorphisms by hybridisation with oligonucleotide arrays on glass supports. Nucleic Acids Res., 22, 5456–5465. - PMC - PubMed
    1. Dawson E., Abecasis,G.R., Bumpstead,S., Chen,Y., Hunt,S., Beare,D.M., Pabial,J., Dibling,T., Tinsley,E., Kirby,S. et al. (2002) A first-generation linkage disequilibrium map of human chromosome 22. Nature, 418, 544–548. - PubMed
    1. Adorjan P., Distler,J., Lipscher,E., Model,F., Müller,J., Pelet,C., Braun,A., Florl,A.R., Gutig,D., Grabs,G. et al. (2002) Tumour class prediction and discovery by microarray-based DNA methylation analysis. Nucleic Acids Res., 30, e21. - PMC - PubMed
    1. Dubiley S., Kirillov,E. and Mirzabekov,A. (1999) Polymorphism analysis and gene detection by minisequencing on an array of gel-immobilized primers. Nucleic Acids Res., 27, e19. - PMC - PubMed

Publication types

MeSH terms