

Comparative Study
doi: 10.1073/pnas.2031891100.
Epub 2003 Sep 19.
Newborn infants can organize the auditory world
Affiliations
- PMID: 14500903
- PMCID: PMC208846
- DOI: 10.1073/pnas.2031891100
Item in Clipboard
Comparative Study
Newborn infants can organize the auditory world
Proc Natl Acad Sci U S A.
.
Abstract
The perceptual world of neonates is usually regarded as not yet being fully organized in terms of objects in the same way as it is for adults. Using a recently developed method based on electric brain responses, we found that, similarly to adults, newborn infants segregate concurrent streams of sound, allowing them to organize the auditory input according to the existing sound source. The segregation of concurrent sound streams is a crucial step in the path leading to the identification of objects in the environment. Its presence in newborn infants shows that the basic abilities required for the development of conceptual objects are available already at the time of birth.
Figures
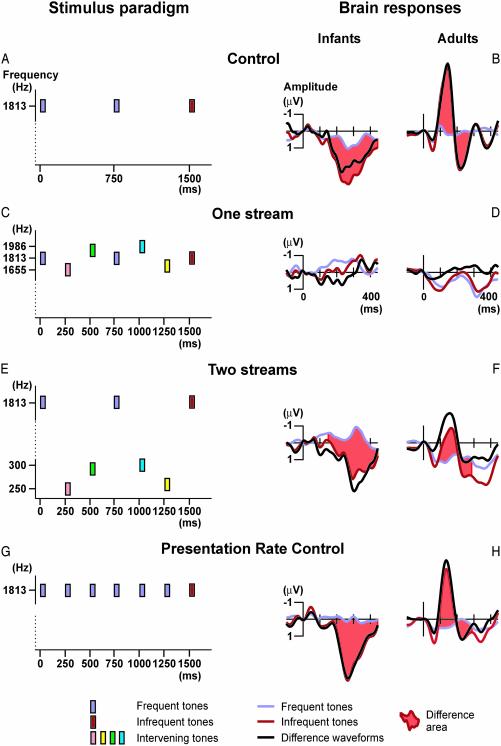
The stimulus paradigm (Left) and electric brain responses (Right). (A) Schematic illustration of a segment of the control-condition sequence. Rectangles represent tones; their y-axis coordinate shows the tone frequency (logarithmic scale). Different loudness-level settings are marked with different colors: pastel blue, frequent soft (standard) tones; dark red, infrequent louder (deviant) tones. (B) Control-condition responses. Frontal (F4) electric brain responses (Left, infants; Right, adults) elicited by the standard (pastel blue lines) and deviant (dark red line) tones together with their respective difference waveform (black line). Tone onset is at the 0-ms mark, and amplitude values are calibrated in microvolt units. The light red shading of the area between the standard and deviant responses marks significant differences between the two brain responses. (C) In the one-stream condition, intervening tones varied in frequency (shown by the y-axis position of the rectangle) and intensity (marked with different colors). (D) One-stream condition responses. The responses to the standard and deviant tones did not significantly differ from each other in either group of subjects. (E) For the two-stream condition, the frequencies of the intervening tones were lowered from the values used in the one-stream condition (see y-axis positions), but the tone intensity values were retained (see rectangle colors). (F) Two-stream condition responses. The responses to the standard and deviant tones significantly differed from each other in both groups of subjects, and they were similar to those elicited in the control condition. (G) In the presentation-rate control experiment, “intervening” tones were identical to the frequent tones (same frequency and same intensity). (H) Presentation-rate control experiment responses. The responses to the standard and deviant tones significantly differed from each other in both groups of subjects and were similar to those elicited in the control and two-stream conditions of the main experiment.
References
-
- DeCasper, A. J. & Fifer, W. P. (1980) Science 208, 1174–1176. - PubMed
-
- Bregman, A. S. (1990) Auditory Scene Analysis: The Perceptual Organization of Sound (MIT Press, Cambridge, MA).
-
- Leslie, A. M., Xu, F., Tremoulet, P. D. & Scholl, B. J. (1998) Trends Cognit. Sci. 2, 10–18. - PubMed
-
- Demany, L. (1982) Infant Behav. Dev. 5, 261–276.
-
- McAdams, S. & Bertoncini, J. (1997) J. Acoust. Soc. Am. 102, 2945–2953. - PubMed
Publication types
MeSH terms
Grants and funding
LinkOut - more resources
Full Text Sources
