. 2003 Sep 30;100(20):11445-50.
doi: 10.1073/pnas.2034995100. Epub 2003 Sep 22.

Two CD95 tumor classes with different sensitivities to antitumor drugs

Affiliations

Two CD95 tumor classes with different sensitivities to antitumor drugs

Alicia Algeciras-Schimnich et al. Proc Natl Acad Sci U S A. .

Abstract

CD95 type I and II cells differ in their dependence on mitochondria to execute apoptosis, because antiapoptotic members of the Bcl-2 family render only type II cells resistant to death receptor-induced apoptosis. They can also be distinguished by a more efficient formation of the death-inducing signaling complex in type I cells. We have identified a soluble form of CD95 ligand (S2) that is cytotoxic to type II cells but does not kill type I cells. By testing 58 tumor cell lines of the National Cancer Institute's anticancer drug-screening panel for apoptosis sensitivity to S2 and performing death-inducing signaling complex analyses, we determined that half of the CD95-sensitive cells are type I and half are type II. Most of the type I cell lines fall into a distinct class of tumor cells expressing mesenchymal-like genes, whereas the type II cell lines preferentially express epithelium-like markers. This suggests that type I and II tumor cells represent different stages of carcinogenesis that resemble the epithelial-mesenchymal transition. We then screened the National Cancer Institute database of >42,000 compounds for reagents with patterns of growth inhibition that correlated with either type I or type II cell lines and found that actin-binding compounds selectively inhibited growth of type I cells, whereas tubulin-interacting compounds inhibited growth of type II cells. Our analysis reveals fundamental differences in programs of gene expression between type I and type II cells and could impact the way actin- and microtubule-disrupting antitumor agents are used in tumor therapy.


Figures
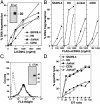
Fig. 1.
Fig. 1.
Sensitivity of type I and II cells to various forms of CD95L. (A) Apoptosis assay of cells treated for 16 h with LzCD95L. (Inset) A G247-4 anti-CD95L immunoblot of LzCD95L. (B) Apoptosis assay of cells treated for 16 h with FLAG-sCD95L in the absence (open circles) or presence (filled circles) of anti-FLAG antibodies. (C) Fluorescence-activated cell sorter analysis of CD95L expression on KB8301-treated CT26-mCD95L cells. Dotted line, isotype control; bold line, NOK-1 staining. (Inset) A G247-4 anti-CD95L immunoblot of mCD95L. (D) In vitro lysis of 51Cr-labeled type I and II cells by CT26-mCD95L cells. After 7 h of incubation, radioactivity in each well was measured and the percentage of specific lysis was calculated as described in Materials and Methods.
Fig. 2.
Fig. 2.
sCD95L efficiently kills type II, but not type I, cells. (A) Apoptosis assay of cells treated for 16 h with S1, S2, or anti-APO-1 (αAPO-1). (B) Apoptosis assay of cells incubated for 16 h with 1 μg/ml of control supernatant (C), LzCD95L (Lz), S1, or S2. In some cases S2 stimulation was performed in the presence of 1 μg/ml anti-CD95 (ZB4) or anti-CD95L (Nok-1) neutralizing antibodies. (Inset) Levels of surface CD95 on parental Jurkat (P) and JurkatR (R) cells as determined by flow cytometry. (C) Apoptosis assay of Jurkat mutants incubated for 16 h with S2. (D) Apoptosis assay of Jurkat cells pretreated with the indicated concentration of cycloheximide (CHX) and stimulated for 16 h with 1 μg/ml S2.
Fig. 3.
Fig. 3.
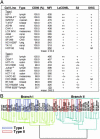
Type I and II tumor cell lines among the NCI60 cells fall into two major classes that differ by expressing different sets of genes. (A) Cell lines were stained for CD95 surface expression. Shown is the percentage of CD95 surface expression, the mean fluorescence intensity (MFI), and apoptosis sensitivity as measured after incubation with 1 μg/ml of either LzCD95L or S2 for 20 h. Cell lines are ordered according to the mean fluorescence intensity of CD95 surface expression. Apoptosis sensitivity was determined by three different methods. (i) Morphological changes typical for apoptosis such as membrane blebbing and cell detachment (only adherent cells). All cell lines were tested at least three times. (ii) The 3-(4,5-dimethylthiazol-2-yl)-5-(3-carboxymethoxyphenyl)-2-(4-sulfophenyl)-2H-tetrazolium (MTS) assay (at least three assays per cell line). (iii) An analysis of formation of the DISC. 1, all lymphoid cells were additionally tested for DNA degradation by using propidium iodide staining of nuclei as described in Materials and Methods; 2, these cell lines were more sensitive (++) to anti-APO-1 plus protein A; 3, not part of the NCI drug-screening panel. The tumor origin is given. nd, not determined; –, apoptotic cells <10%; –/+, 10–25%; +, 25–50%; ++, >50%. The cell lines 786-0, A549/ATCC, COLO 205, DU-145, EKVX, HS 578T, HT29, K562, M14, MALME-3M, MCF-7, MDA-MB-231, MDA-MB-435, MOLT4, NCI/ADR-RES, OVCAR-5, SF-268, SF-539, SK-MEL-2, SK-MEL-5, SK-OV-3, SN12C, SNB-19, SW-620, UACC-257, U251, and HOP-62 were completely and consistently resistant to CD95-mediated apoptosis in all assays (data not shown). (B) CD95-sensitive tumor cell lines identified as types I and II as shown in A are boxed in blue and red, respectively. The length of the dendrogram branches connecting pairs of nodes is directly proportional to the differences in gene expression of the 1,161 transcripts (of 9,703 total) that had been shown to vary at least 7-fold among the NCI60 cells (11). Cell lines in gray were not available to us for analysis. The two main branches representing tumor cells with increased expression of either mesenchymal (Branch I) or epithelial (Branch II) markers are colored in green or turquoise, respectively. [Reproduced with permission from Ross et al. (11) (Copyright 2000, Nature Genetics).]

Similar articles

Cited by

References

    1. Peter, M. E. & Krammer, P. H. (2003) Cell Death Differ. 10, 26–35. - PubMed
    1. Scaffidi, C., Fulda, S., Srinivasan, A., Friesen, C., Li, F., Tomaselli, K. J., Debatin, K. M., Krammer, P. H. & Peter, M. E. (1998) EMBO J. 17, 1675–1687. - PMC - PubMed
    1. Scaffidi, C., Schmitz, I., Zha, J., Korsmeyer, S. J., Krammer, P. H. & Peter, M. E. (1999) J. Biol. Chem. 274, 22532–22538. - PubMed
    1. Barnhart, B. C., Alappat, E. & Peter, M. E. (2003) Semin. Immunol. 15, 185–193. - PubMed
    1. Algeciras-Schimnich, A., Shen, L., Barnhart, B. C., Murmann, A. E., Burkhardt, J. & Peter, M. E. (2002) Mol. Cell. Biol. 22, 207–220. - PMC - PubMed

Publication types