

Evolutionary dynamics of an Arabidopsis insect resistance quantitative trait locus
- PMID: 14506289
- PMCID: PMC304123
- DOI: 10.1073/pnas.1734046100
Evolutionary dynamics of an Arabidopsis insect resistance quantitative trait locus
Abstract
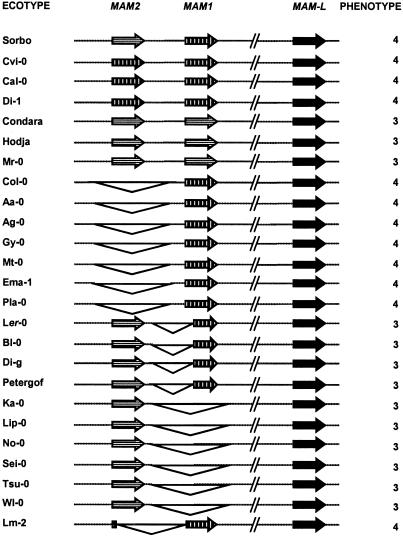
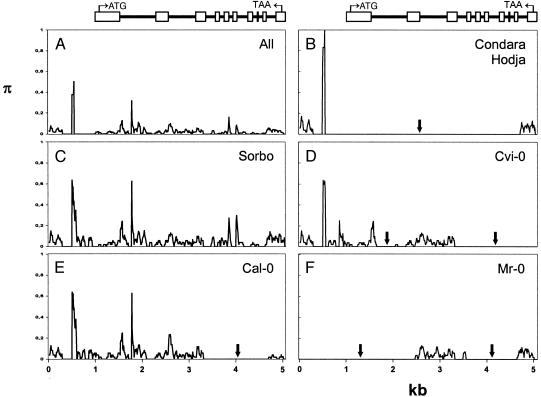
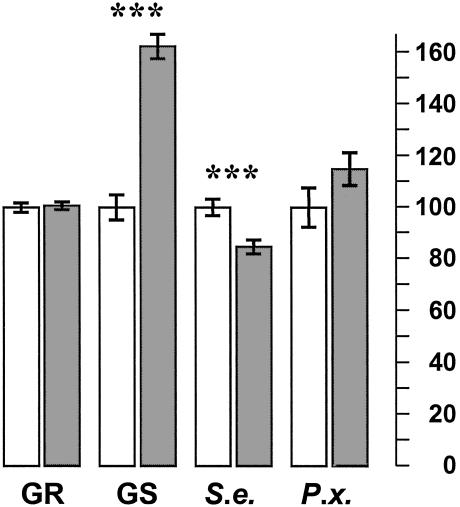
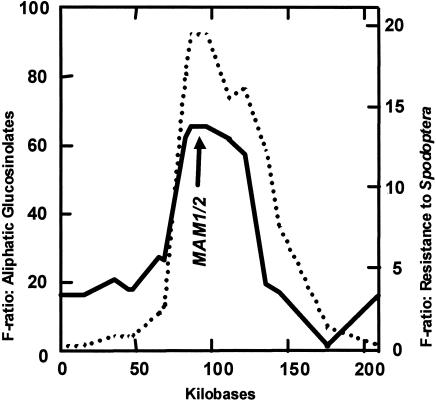
Glucosinolate profiles differ among Arabidopsis thaliana ecotypes, caused by the composition of alleles at several glucosinolate biosynthetic loci. One of these, GS-Elong, harbors a family of methylthioalkylmalate synthase (MAM) genes that determine the side chain length of aliphatic glucosinolate structures. Fine mapping reveals that GS-Elong constitutes an insect resistance quantitative trait locus, caused by variation in glucosinolate profiles conferred by polymorphism of MAM alleles in this region. A sequence survey of randomly chosen ecotypes indicates that GS-Elong is highly variable among A. thaliana ecotypes: indel polymorphisms are frequent, as well as gene conversion events between gene copies arranged in tandem. Furthermore, statistical methods of molecular population genetics suggest that one of the genes, MAM2, is subject to balancing selection. This may be caused by ecological tradeoffs, i.e., by contrasting physiological effects of glucosinolates on generalist vs. specialist insects.
Figures
References
-
- Rausher, M. D. (2001) Nature 411, 857-864. - PubMed
-
- Halkier, B. A. (1999) Trends Plant Sci. 11, 425-431.
-
- Rask, L., Andreasson, E., Ekbom, B., Eriksson, S., Pontoppidan, B. & Meijer, J. (2000) Plant Mol. Biol. 42, 93-113. - PubMed
-
- Reichelt, M., Brown, P. D., Schneider, B., Oldham, N. J., Stauber, E., Tokuhisa, J., Kliebenstein, D. J., Mitchell-Olds, T. & Gershenzon, J. (2002) Phytochemistry 59, 663-671. - PubMed
Publication types
MeSH terms
Substances
Associated data
- Actions
- Actions
- Actions
- Actions
- Actions
- Actions
- Actions
- Actions
- Actions
- Actions
- Actions
- Actions
- Actions
- Actions
- Actions
- Actions
- Actions
- Actions
- Actions
- Actions
- Actions
- Actions
- Actions
- Actions
- Actions
- Actions
- Actions
- Actions
- Actions
- Actions
- Actions
- Actions
- Actions
- Actions
- Actions
- Actions
- Actions
- Actions
- Actions
- Actions
- Actions
- Actions
- Actions
- Actions
- Actions
- Actions
- Actions
- Actions
- Actions
- Actions
- Actions
- Actions
- Actions
- Actions
- Actions
- Actions
- Actions
- Actions
- Actions
- Actions
- Actions
- Actions
- Actions
- Actions
- Actions
- Actions
- Actions
- Actions
- Actions
- Actions
- Actions
- Actions
LinkOut - more resources
Full Text Sources
Other Literature Sources
Molecular Biology Databases
