

doi: 10.1073/pnas.2035060100.
Epub 2003 Sep 23.
Estimating mean lifetime
Affiliations
- PMID: 14506294
- PMCID: PMC263728
- DOI: 10.1073/pnas.2035060100
Item in Clipboard
Estimating mean lifetime
Proc Natl Acad Sci U S A.
.
Abstract
The life expectancy implied by current age-specific mortality rates is calculated with life table methods that are among the oldest and most fundamental tools of demography. We demonstrate that these conventional estimates of period life expectancy are affected by an undesirable "tempo effect." The tempo effect is positive when the mean age at death is rising and negative when the mean is declining. Estimates of the effect for females in three countries with high and rising life expectancy range from 1.6 yr in the U.S. and Sweden to 2.4 yr in France for the period 1980-1995.
Figures
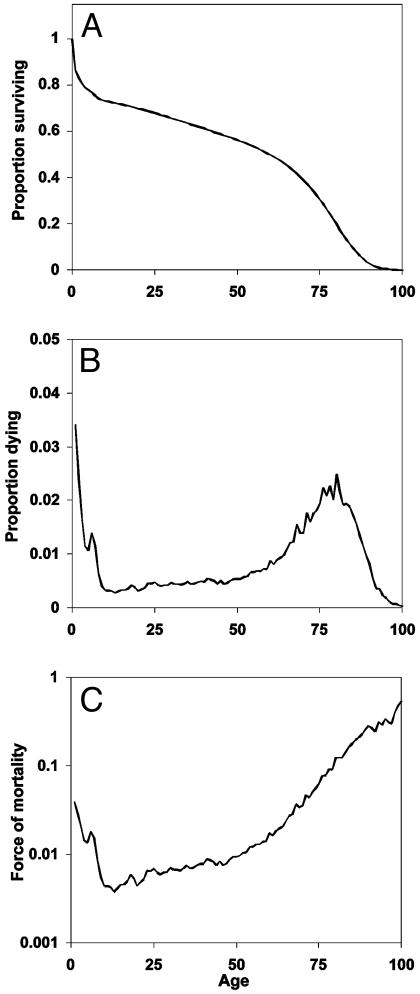
Mortality experience of the cohort of Swedish females born in 1850, as summarized by the survival function, l(a)(A), the death density function d(a) (B), and the force of mortality function μ(a) (C).
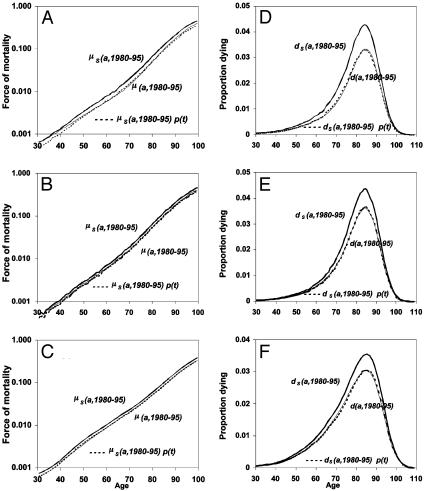
Average force of mortality for 1980–1995, observed as μ(a, t), estimated from l(a, t) as μs(a, t), and estimated as the product μs(a,1980–1995)p(t) for France (A), Sweden (B), and the U.S. (C). Also shown is the average death density function for 1980–1995, observed as d(a, t), estimated from l(a, t) as ds(a, t), and estimated as the product ds(a,1980–1995)p(t) for France (D), Sweden (E), and the U.S. (F).
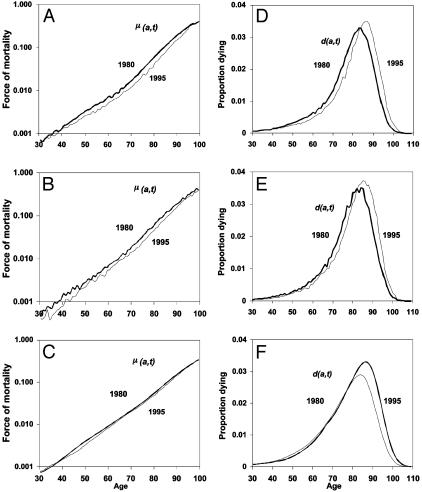
Observed period force of mortality μ(a, t) in 1980 and 1995 for France (A), Sweden (B), and the U.S. (C). Also shown is the observed period death density function d(a, t) in 1980 and 1995 for France (D), Sweden (E), and the U.S. (F).
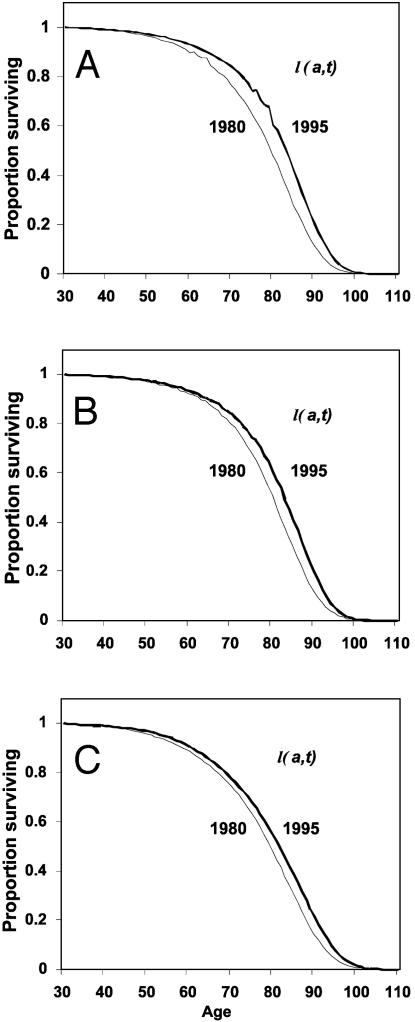
Observed period survival function l(a, t) in 1980 and 1995 for France (A), Sweden (B), and the U.S. (C).
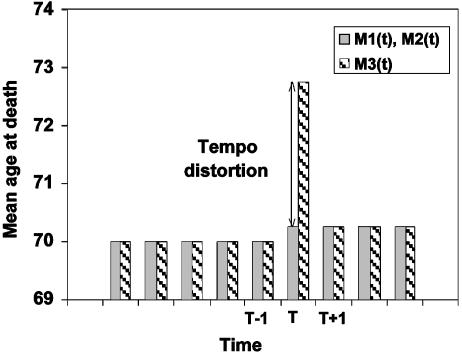
Hypothetical illustration of effect of increase in mean age at death by 0.25 yr (from 70.0 to 70.25) during year T on conventional life expectancy. Before and after T, M1(t) = M2(t) = M3(t). During T, a tempo distortion of -25% in the number of deaths results in an upward distortion of ≈2.5 yr in M3(t).
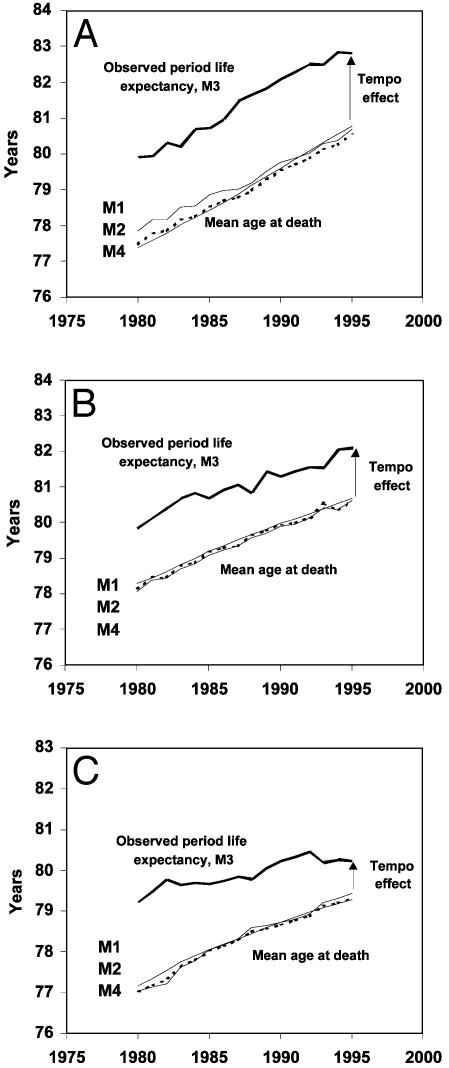
Trends from 1980 to 1995 for alternative estimates of mean age at death M1, M2, M3, and M4 for France (A), Sweden (B), and the U.S. (C). The difference M3 - M4 equals the tempo effect.
References
-
- Preston, S. H., Heuveline, P. & Guillot, M. (2001) Demography: Measuring and Modeling Population Processes (Blackwell, Malden, MA).
-
- Hajnal, J. (1953) Popul. Studies 7, 111-136.
-
- United Nations (1990) Patterns of First Marriage (United Nations, New York).
-
- Council of Europe (2001) Recent Demographic Developments in Europe 2001 (Council of Europe Publishing, Strasbourg, France).
-
- Bongaarts, J. & Feeney, G. (2002) Popul. Dev. Rev. 28, 13-29.
MeSH terms
LinkOut - more resources
Full Text Sources
