Review
. 2003 Oct;83(4):1401-53.
doi: 10.1152/physrev.00012.2003.

Interactions between membrane conductances underlying thalamocortical slow-wave oscillations

Affiliations
Review

Interactions between membrane conductances underlying thalamocortical slow-wave oscillations

A Destexhe et al. Physiol Rev. 2003 Oct.

Abstract

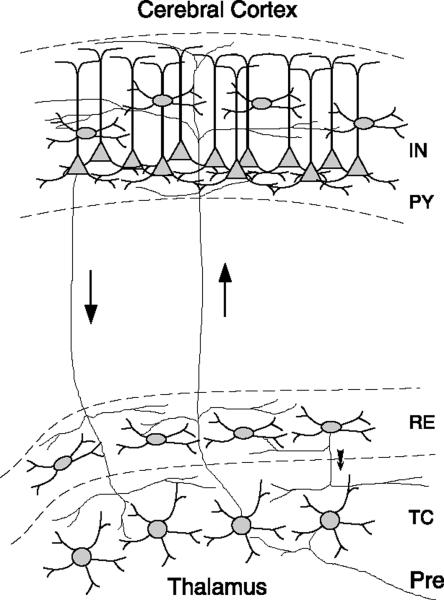
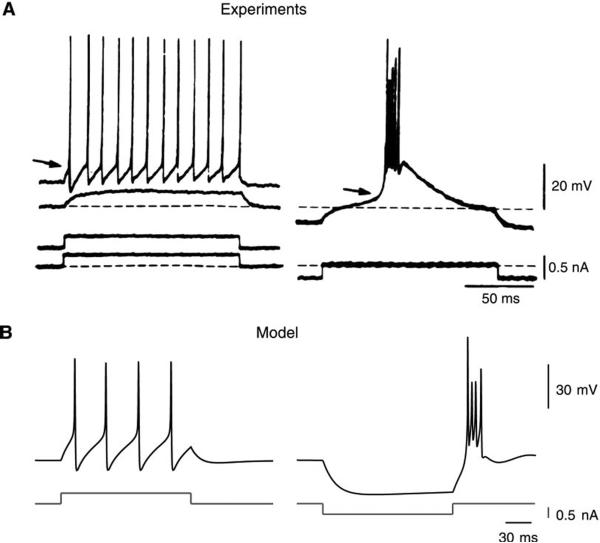
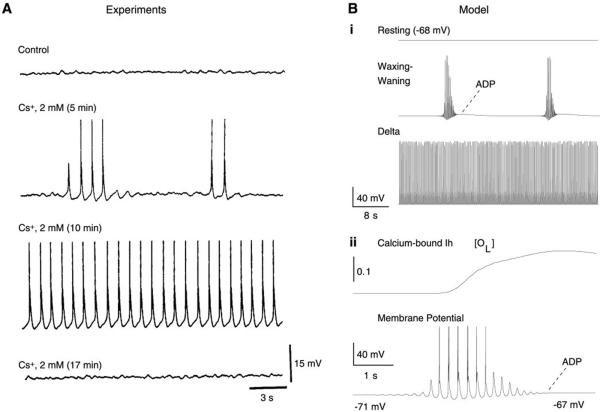
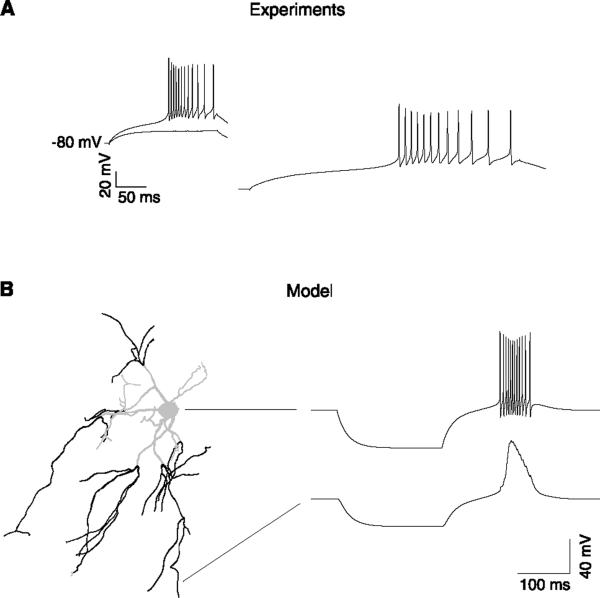
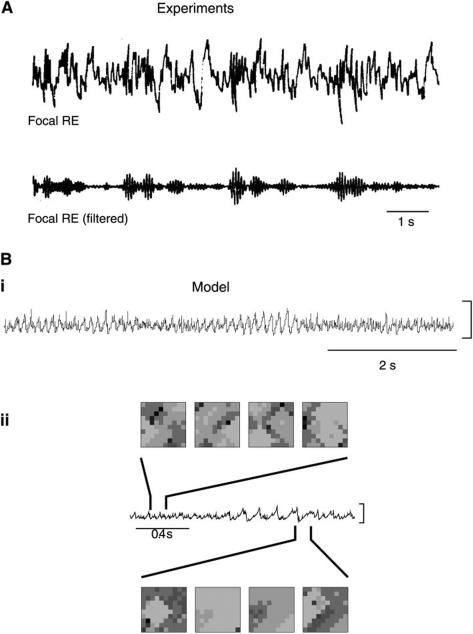
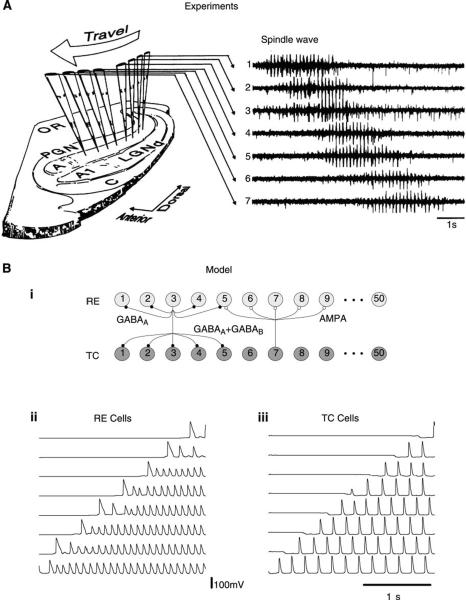
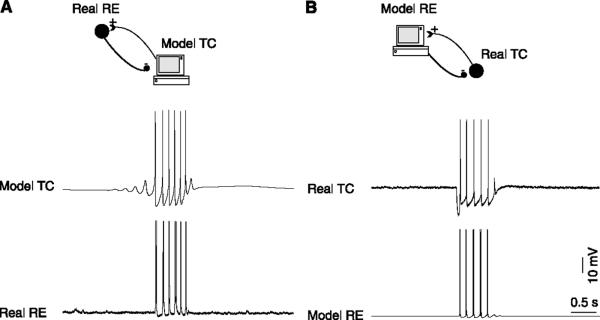
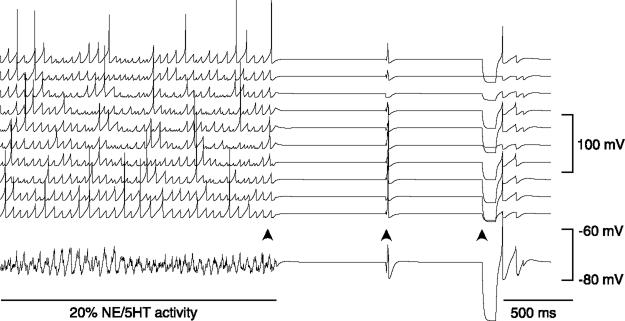
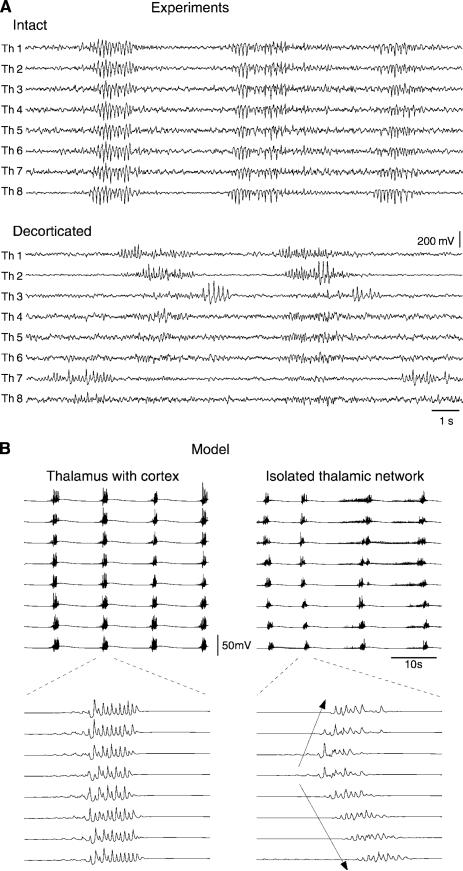
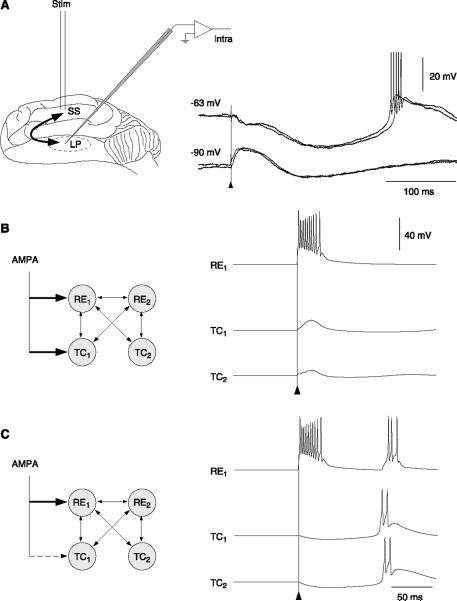
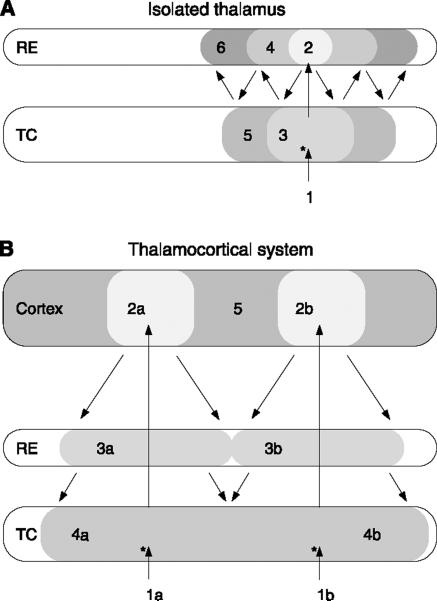
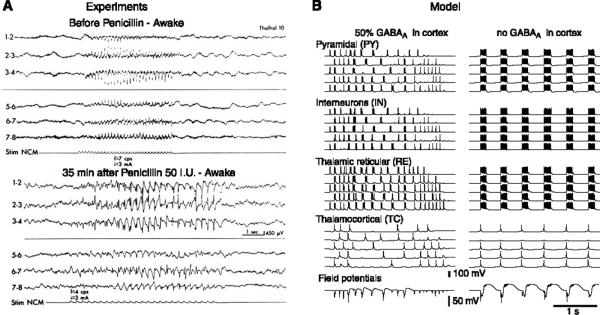
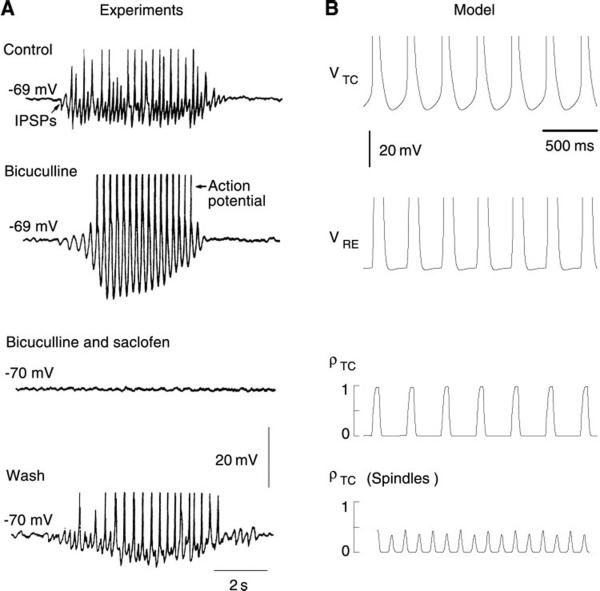
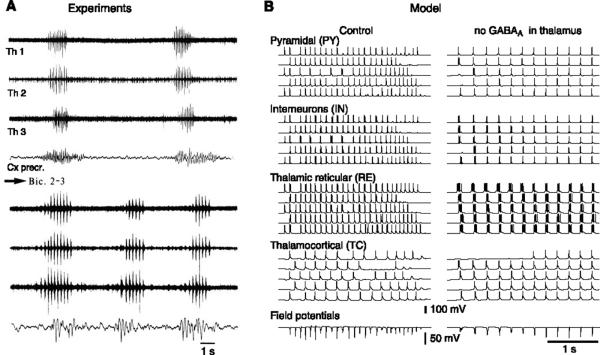
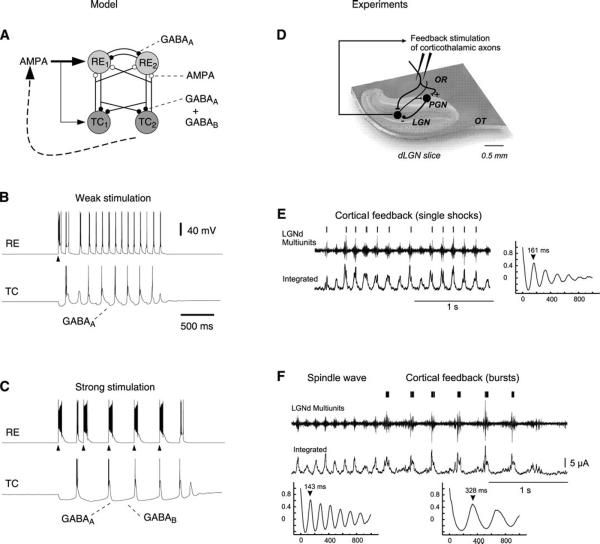
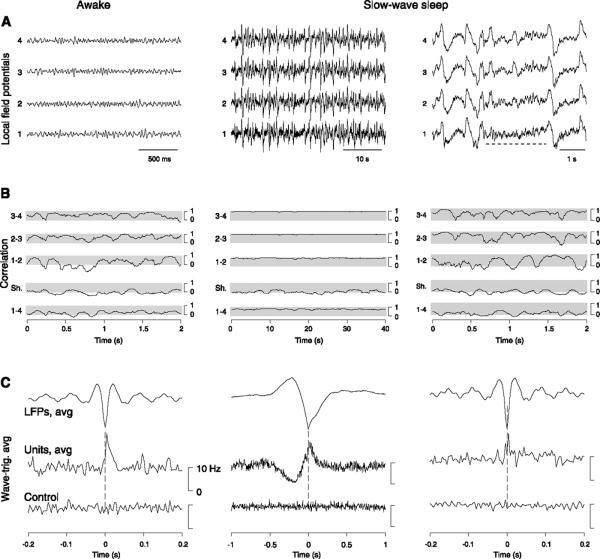
Neurons of the central nervous system display a broad spectrum of intrinsic electrophysiological properties that are absent in the traditional "integrate-and-fire" model. A network of neurons with these properties interacting through synaptic receptors with many time scales can produce complex patterns of activity that cannot be intuitively predicted. Computational methods, tightly linked to experimental data, provide insights into the dynamics of neural networks. We review this approach for the case of bursting neurons of the thalamus, with a focus on thalamic and thalamocortical slow-wave oscillations. At the single-cell level, intrinsic bursting or oscillations can be explained by interactions between calcium- and voltage-dependent channels. At the network level, the genesis of oscillations, their initiation, propagation, termination, and large-scale synchrony can be explained by interactions between neurons with a variety of intrinsic cellular properties through different types of synaptic receptors. These interactions can be altered by neuromodulators, which can dramatically shift the large-scale behavior of the network, and can also be disrupted in many ways, resulting in pathological patterns of activity, such as seizures. We suggest a coherent framework that accounts for a large body of experimental data at the ion-channel, single-cell, and network levels. This framework suggests physiological roles for the highly synchronized oscillations of slow-wave sleep.


Figures

FIG. 1
FIG. 1
Arrangement of inputs and output projections in the thalamocortical system. Four cell types and their connectivity are shown: thalamocortical (TC) relay cells, thalamic reticular (RE) neuron, cortical pyramidal cells (PY), and interneurons (IN). TC cells receive prethalamic (Pre) afferent connections, which may be sensory afferents in the case of specific thalamic nuclei involved in vision, audition, and somatosensory modalities. This information is relayed to the corresponding area of cerebral cortex through ascending thalamocortical fibers (upward arrow). These axons have collaterals that contact the RE nucleus on the way to the cerebral cortex, where they arborize in superficial layers I and II, layer IV, and layer VI. Corticothalamic feedback is mediated primarily by a population of layer VI PY neurons that project to the thalamus. The corticothalamic fibers (downward arrow) also leave collaterals within the RE nucleus and dorsal thalamus. RE cells thus form an inhibitory network that surrounds the thalamus, receive a copy of nearly all thalamocortical and corticothalamic activity, and project inhibitory connections solely to neurons in the thalamic relay nuclei. Projections between TC, RE, and PY cells are usually organized topographically such that each cortical column is associated with a given sector of thalamic TC and RE cells. [Modified from Destexhe et al. (100).]
FIG. 2
FIG. 2
Intrinsic electrophysiological properties of thalamic relay neurons. A: intracellular recordings of guinea pig thalamic relay neurons in vitro. Left: a depolarization that is subthreshold at resting level (bottom trace) produced repetitive firing if delivered at a depolarized direct-current (DC) level (top trace). Right: when the same stimulus was given at a hyperpolarized DC level, the cell produced high-frequency bursts of action potentials. [Modified from Llinas and Jahnen (209).] B. computational model. Tonic and burst responses were obtained in a single-compartment model including various voltage-dependent currents, such as IT and the INa and IKd currents for generating action potentials. Tonic and burst responses could be obtained either by various stimuli at the same membrane voltage (left) or by the same stimulus applied at different membrane potential levels (right). [Modified from McCormick and Huguenard (225).]
FIG. 3
FIG. 3
Intrinsic oscillatory properties of thalamic relay neurons. A: intracellular recordings of a cat thalamic relay neuron in vitro showing different oscillatory modes following application of cesium (Cs+). Cs+ was applied extracellularly to a cell that had no spontaneous oscillations (control). Four minutes after the application of Cs+, spontaneous waxing-and-waning oscillations began (silent periods of 4–9 s and oscillatory sequences lasting for 2–6 s). After an additional 4 min, the oscillations became sustained (frequency of 1–2 Hz) and persisted for ~6 min before all activity ceased. [Modified from Soltesz et al. (290).] B: computational model of intrinsic oscillations in thalamic relay cells. The model had a calcium-mediated regulation of Ih. i: Three different modes with different conductance values of Ih. From top to bottom: relay state (gh = 0.025 mS/cm2), slow waxing-and-waning (“spindle-like”) oscillations (gh = 0.02 mS/cm2), and delta oscillations (gh = 0.005 mS/cm2). ii: Intrinsic waxing-and-waning oscillation at higher time resolution. Top trace shows the fraction of channels in the calcium-bound open state (OL), and the membrane potential is shown at bottom. [Modified from Destexhe et al. (96).]
FIG. 4
FIG. 4
Bursting properties of thalamic reticular neurons. A: bursts evoked in a rat thalamic reticular neuron in vitro. Bursts were obtained after intracellular injection of depolarizing current pulses. A slight change in injected current amplitude resulted in an apparently all-or-none burst response. Bottom trace indicates a burst on a 5 times faster time scale. B: computational model of burst generation in thalamic reticular neurons with dendritic IT. Left: morphology of a thalamic reticular neuron from rat ventrobasal thalamus, which was reconstructed and incorporated in simulations. The dark areas indicate the dendrites with high density of T-type current (0.045 mS/cm2 in soma, 0.6 mS/cm2 in distal dendrites). Right: burst generated in this model following current injection in the soma (top trace; 0.3 nA during 200 ms). The voltage in distal dendrites (bottom trace) shows a slow rising and decaying calcium spike mediated by ITs. In both cases, the bursts had a slow rising phase, and sodium spikes within a burst showed a typical accelerando-decelerando pattern. [Modified from Destexhe et al. (99).]
FIG. 5
FIG. 5
Oscillations in the isolated reticular nucleus. A: spontaneous oscillations in the spindle frequency range obtained in the deafferented thalamic reticular nucleus in vivo. The field potentials recorded in the isolated RE nucleus show rhythmicity in the spindle frequency range (bottom trace was filtered between 7 and 14 Hz). [Modified from Steriade et al. (308).] B: model of oscillations mediated by GABAA synapses in the RE nucleus. i: Oscillations in a network of 400 RE neurons in which each cell was connected to its 24 nearest neighbors. The average value of the membrane potentials shows oscillations with a similar frequency as in the experiments. ii: Snapshots of activity in a 100 RE neuron network during waxing-and-waning oscillations corresponding to the regions of the averaged membrane potential as indicated. The top series of snapshots was taken during the “desynchronized” phase and shows highly irregular spatiotemporal behavior. The bottom series of snapshots was taken during the “oscillatory” phase, when the network is more synchronized and coherent oscillations were found in the averaged activity. The time interval between frames was 40 ms. [Modified from Destexhe et al. (97).]
FIG. 6
FIG. 6
Spindle waves resulting from interactions between thalamic relay and reticular neurons. A: spindle sequence recorded both intracellularly and extracellularly in ferret visual thalamus in vitro. An intracellular recording was performed in a thalamic reticular neuron (second trace), located in the perigeniculate (PGN) sector of the thalamic slice, together with an extracellular recording (top trace) of relay cells in the dorsal lateral geniculate (LGNd) sector of the slice. Another spindle sequence is shown recorded intracellularly in a relay neuron (LGNd, bottom trace), together with an extracellular recording of relay cells (LGNd, third trace). RE cells tended to burst at every cycle of the oscillation, while TC cells burst every 2 or 3 cycles. [Modified from von Krosigk et al. (346).] B: spindle oscillations in a 100-neuron network of thalamic relay and reticular cells. Synaptic interactions were mediated by AMPA receptors (from TC to RE), a mixture of GABAA and GABAB receptors (from RE to TC), and GABAA-mediated lateral inhibition between RE cells (see Ref. 353 for details of the model). The fraction of TC and RE cells that are simultaneously active (ρTC and ρRE) are indicated together with one representative example of the membrane potential for each cell type (VTC and VRE) during spindle oscillations. Individual TC cell produced bursts at a subharmonic frequency of the network oscillation, but the population of TC cells oscillated at the spindle frequency (see raster plot in bottom graph). [Modified from Wang et al. (353).]
FIG. 7
FIG. 7
Propagation of spindle waves in isolated thalamic networks. A: propagating spindle waves in ferret thalamic slices. Left: drawing of a sagittal ferret dorsal lateral geniculate nucleus (dLGN) slice with an array of 8 multiunit electrodes arranged in lamina A. Electrodes were separated by 250–400 μm, extending over 2–3 mm in the dorsoventral axis. Right: example of a propagating spindle wave. The spindle wave started in the dorsal end of the slice and propagated ventrally. Each spindle wave consisted of waxing-and-waning rhythmic action potential bursts with interburst frequency of 6–10 Hz. [Modified from Kim et al. (182).] B: propagating spindle oscillations in a network of thalamocortical and thalamic reticular cells. i: Schematic diagram of connectivity of a one-dimensional network of TC and RE cells with localized axonal projections. ii: Membrane potential of 8 RE cells equally spaced in the network during spindle oscillations. iii: Membrane potential of 8 TC cells equally space in the network (same simulation as in ii). [ii and iii modified from Golomb et al. (136).]
FIG. 8
FIG. 8
Reconstruction of spindle waves from hybrid thalamic circuits. Thalamic neurons were recorded intracellularly in ferret thalamic slices and were coupled to computational models in real time. A: intracellularly recorded thalamic reticular neuron (nRt/PGN) coupled to a model thalamic relay cell (TC). Synaptic interactions were mediated by AMPA receptors (from TC to nRt/PGN) and GABAA receptors (from nRt/PGN to TC) and were simulated using the dynamic-clamp technique. B: intracellularly recorded thalamic relay neuron (TC) coupled to a model thalamic reticular cell (nRt/PGN) using a similar coupling procedure. In both cases, oscillations in the spindle frequency range emerged from these circuits, although none of the cells was a spontaneous oscillator. The oscillations waxed and waned due to calcium-mediated upregulation of Ih in the TC cell. Models were single-compartment modifications from Ref. 105. [Modified from LeMasson et al. (193).]
FIG. 9
FIG. 9
Neuromodulation can explain why networks of RE cells spontaneously oscillate in vivo but not in vitro. Simulation of a network with 100 RE cells locally interconnected through GABAA synapses. Oscillations were possible only if RE cells had a sufficiently depolarized resting membrane potential (about −65 mV in this case), close to in vivo measurements. This depolarization was provided here using kinetic models of the block of K+ conductances by noradrenergic/serotonergic (NE/5-HT) neuromodulatory synapses. In the absence of this neuromodulatory drive, leak K+ conductances were fully activated, and the resting level of RE cells was more hyperpolarized (−75 mV in this case), close to in vitro measurements. In this case, the network of RE cells was unable to sustain oscillations. The figure shows the transition between these two states: NE/5-HT synapses were initially active, as in vivo, allowing the network to display waxing-and-waning oscillations at a frequency of 10–16 Hz. After 2 s (first arrow), all NE/5-HT synaptic activity was suppressed; the resulting hyperpolarization prevented the network from sustaining oscillations. Depolarizing (second arrow) or hyperpolarizing (third arrow) current pulses injected simultaneously in all neurons (with random amplitude) could not restore spontaneous oscillations. This latter situation may correspond to the conditions of RE cells in vitro. [Modified from Destexhe et al. (98).]
FIG. 10
FIG. 10
The large-scale synchrony of spindle oscillations depends on corticothalamic feedback. A: removal of the cerebral cortex affects the pattern of spindle oscillations in the thalamus. Field potentials were recorded using 8 tungsten electrodes equidistant of 1 mm (Th1–Th6) inserted in the cat thalamus under barbiturate anesthesia in the intact brain (Intact) and after removal of the cortex (Decorticated). After decortication, recordings from approximately the same thalamic location showed that spindling continued at each electrode site, but their coincidence in time was lost. The 8-electrode configuration was positioned at different depths within the thalamus (from −2 to −6) and different lateral planes (from 2 to 5); all positions gave the same result. [Modified from Contreras et al. (60).] B: computational model of large-scale coherence in the thalamocortical system. Spontaneous spindles are shown in the presence of the cortex (left panels) and in an isolated thalamic network (right panels) under the same conditions. The traces indicate local averages computed from 21 adjacent TC cells sampled from 8 equally spaced sites on the network. Bottom graphs represent averages of a representative spindle at 10 times higher temporal resolution. The near-simultaneity of oscillations in the presence of the cortex is qualitatively different from the propagating patterns of activity in the isolated thalamic network (arrows). [Modified from Destexhe et al. (100).]
FIG. 11
FIG. 11
“Inhibitory dominance” of corticothalamic feedback on thalamic relay cells. A: intracellular recording of a TC cell in the lateral posterior (LP) thalamic nucleus while stimulating the anatomically related part of the suprasylvian cortex in cats during barbiturate anesthesia. Cortical stimulation (arrow) evoked a small excitatory postsynaptic potential (EPSP) followed by a powerful biphasic inhibitory postsynaptic potential (IPSP). The IPSP gave rise to a rebound burst in the TC cell. This example was representative of the majority of recorded TC cells. B: simulation of cortical EPSPs (AMPA-mediated) in a circuit of 4 interconnected thalamic cells. Cortical EPSPs were stimulated by delivering a presynaptic burst of 4 spikes at 200 Hz to AMPA receptors. The maximal conductance was similar in TC and RE cells (100 nS in this case), and no rebound occurred after the stimulation (arrow). C: simulation of dominant IPSP in TC cell. In this example, the AMPA conductance of stimulated EPSPs in the TC cell was reduced to 5 nS. The stimulation of AMPA receptors evoked a weak EPSP followed by strong IPSP, then by a rebound burst in the TC cells, as observed experimentally. [Modified from Destexhe et al. (100).]
FIG. 12
FIG. 12
Proposed mechanisms for large-scale synchrony. A: reciprocal recruitment of thalamocortical (TC) relay cells and thalamic reticular (RE) cells synchronize cells in the isolated thalamus. From an initial discharge of a TC cell (1; asterisk), a localized area of RE cells was recruited (2), which in turn recruited a larger neighboring TC cells (3), and so forth. Progressively larger areas of the thalamus were recruited on each successive cycle (4, 5, 6,…) through the topographic structure of the connectivity. An array or electrodes would record propagating oscillations, as found in thalamic slices (181). B: thalamic recruitment mechanism involving the cortex. Two approximately simultaneous initiation sites in the thalamus (1a, 1b) recruited localized cortical areas (2b, 2c), which in turn recruited the connected areas of the RE nucleus (3a, 3b), which in turn recruited larger areas of TC cells (4a, 4b), etc. At the next cycle, the entire cortical area was recruited (5). The corticothalamic connections overshadowed the local thalamic recruitment mechanisms shown in A, and oscillations achieved large-scale synchrony within a few cycles, consistent with in vivo data (63). [Modified from Destexhe et al. (100).]
FIG. 13
FIG. 13
The 3-Hz spike-and-wave discharges obtained by altering cortical inhibition. A: spike-and-wave discharges following diffuse application of penicillin to the cortex of cats. Top: stimulation of nucleus centralis medialis (NCM; 7 Hz) induced a recruiting response in the cortex. Bottom: after diffuse application of a diluted solution of penicillin to the cortex (50 IU/hemisphere) in the same animal, 4-Hz stimulation of NCM elicited bilaterally synchronous spike-and-wave activity. Similar spike-and-wave discharges also occurred spontaneously. [Modified from Gloor et al. (130).] B: computational model of the transformation of spindle oscillations into ~3 Hz spike-and-wave by reducing cortical inhibition. A thalamocortical network of 400 neurons was simulated, and 5 cells of each type are shown from top to bottom. The last traces show the field potentials generated by the array of pyramidal neurons. Left: 50% decrease of GABAA-mediated inhibition in cortical cells. The oscillation begins like a spindle, but strong burst discharges appear after a few cycles, leading to large-amplitude negative spikes followed by slow positive waves in the field potentials. Right: fully developed spike-and-wave oscillations following suppression of GABAA-mediated inhibition in cortical cells. All cells had prolonged, in-phase discharges, separated by long periods of silence, at a frequency of ~2 Hz. GABAB currents were maximally activated in TC and PY cells during the periods of silence. Field potentials displayed spike-and-wave complexes. Thalamic inhibition was intact in A and B. [Modified from Destexhe (86).]
FIG. 14
FIG. 14
Slow thalamic oscillation after suppression of GABAA-mediated inhibition. A: intracellular recording of a relay neuron in the dorsal lateral geniculate nucleus in ferret thalamic slices during spindle waves. Blocking GABAA receptors by bath application of bicuculline (second trace) slowed the oscillation to 2–4 Hz and markedly increased rebound burst activity. Further application of the GABAB receptor antagonist saclofen abolished this slow oscillation (third trace). Recovery after washout of antagonists shows that these effects are reversible (last trace). [Modified from von Krosigk et al. (346).] B: computational model of the 3-Hz thalamic oscillation in thalamic networks. The graphs show (from top to bottom) a representative example of the membrane potential of TC and RE cells (VTC, VRE), the fraction of TC cells (ρTC) active as a function of time during slow oscillations, as well as during spindle oscillations for comparison (bottom graph). In control conditions, the network generated 6- to 7-Hz spindle oscillations (shown in Fig. 6B). After suppressing GABAA receptors, the circuit showed a slow 2- to 3-Hz oscillation, which was more synchronized than spindle oscillations (see ρTC in bottom graphs). [Modified from Wang et al. (353).]
FIG. 15
FIG. 15
Block of thalamic GABAA inhibition does not generate spike-and-wave. A: local injection of bicuculline in the thalamus of a cat under barbiturate anesthesia. Top: before injection, three thalamic multiunit recordings (Th1–Th3) from foci separated by 2 mm revealed bursts of action potentials corresponding to spindle oscillations. These oscillations are also reflected in the EEG from the ipsilateral pericruciate cortex (Cx prec.). Bottom: injection of bicuculline between electrodes 2 and 3 increased the number of action potentials per burst and reduced the oscillation frequency from 10 to ~4 Hz. This reduced frequency was reflected in the EEG, but no spike-and-wave discharges were observed. [Modified from Steriade and Contreras (302).] B: suppression of thalamic GABAA inhibition in a computational model of the thalamocortical system. Left: spindle oscillations in the thalamocortical network in control conditions. The field potentials, consisting of successive negative deflections at ~10 Hz, are shown at the bottom. Right: oscillations following the suppression of GABAA-mediated inhibition in thalamic cells with cortical inhibition intact. The network generated synchronized oscillations at ~4 Hz, with thalamic cells displaying prolonged discharges. The discharge pattern of PY cells resembled spindles but at a lower frequency, as reflected in the field potentials (bottom). [Modified from Destexhe (86).]
FIG. 16
FIG. 16
Cortical feedback can control the frequency and synchrony of thalamic oscillations. A: computational model prediction that cortical feedback can force intact thalamic circuits to oscillate at 3 Hz. A scheme of connectivity and receptor types in a circuit of thalamocortical (TC) and thalamic reticular (RE) neurons is shown. Corticothalamic feedback was simulated through AMPA-mediated synaptic inputs (shown on the left of the connectivity diagram) and could be directly triggered by the discharge of TC cells. [Modified from Destexhe (86).] B: a single stimulation of corticothalamic feedback (arrow) entrained the circuit into a 10-Hz mode similar to spindle oscillations. C: after 3-Hz stimulation with high intensity (arrows; 14 spikes/stimulus), RE cells were recruited into large bursts, which evoked IPSPs onto TC cells dominated by GABAB-mediated inhibition. In this case, the circuit could be entrained into a different oscillatory mode, with all cells firing in synchrony. D: implementation of this paradigm in thalamic slices. Stimulating electrodes were placed in the optic radiation (OR), which contains corticothalamic axons connecting thalamocortical cell in the LGN layers and GABAergic interneurons in the perigeniculate nucleus (PGN). E: weak (single shock) stimulation at a latency of 20 ms after the detection of multiunit bursts activity (top trace). Bottom trace: smooth integration of the multiunit signal. F: a 7-Hz control spindle is robustly slowed to 3-Hz oscillation by the feedback stimulation (5 shocks, 100 Hz, 20-ms delay). [Modified from Bal et al. (18).]
FIG. 17
FIG. 17
Spatial and temporal coherence of wake and sleep oscillations. A: bipolar local field potential (LFP) recordings at 4 equidistant sites (1 mm interelectrode distance) in suprasylvian cortex of cats during natural wake (left) and slow-wave sleep states (middle; note different time scale). Awake periods consisted in low-amplitude fast (20–60 Hz) activity while slow-wave sleep was dominated by waves of slower frequency (0.5–4 Hz) and larger amplitude. Right panel shows a period of slow-wave sleep with higher magnification, in which a brief episode of fast oscillations was apparent (dotted line). B: correlations between different sites, calculated in moving time windows. Correlations were fluctuating between high and low values between neighboring sites during fast oscillations (left), but rarely attained high values for distant sites (1–4; “Sh.” indicates the control correlation obtained between electrode 1 and the same signal taken 20 s later). In contrast, correlations always stayed high during slow-wave sleep (middle). Episodes of fast oscillations during slow-wave sleep (right) revealed similar correlation patterns as during the wake state. C: wave-triggered averages between extracellularly recorded units and LFP activity. During the wake state, the negativity of fast oscillations was correlated with an increase of firing (left; “control” indicates randomly shuffled spikes). The negativity of slow-wave complexes was correlated with an increased firing preceded by a silence in the units (middle; note different time scale). During the brief episodes of fast oscillations of slow-wave sleep (right), the correspondence between units and LFP was similar as in wakefulness. [Modified from Destexhe et al. (101).]
FIG. 18
FIG. 18
Evidence that spindle oscillations evoke calcium entry in pyramidal neurons. A: in vivo intracellular recordings in suprasylvian cortical neurons during spindle oscillations under barbiturate anesthesia. i: Simultaneous recording of intracellular and extracellular activity. ii: Each cycle of the spindle oscillation corresponds to EPSP/IPSP sequences in the recorded pyramidal neuron. iii: Dual intracellular recording in which one of the neurons (middle trace) was recorded with chloride-filled pipettes. In this case, the EPSP/IPSP sequence transformed into a powerful burst of action potentials. B: computational models of thalamic inputs in pyramidal neurons. i: Morphology used in the simulations. A layer V pyramidal neuron recorded intracellularly in A was filled and its morphology was integrated into simulations. Simulations of thalamic inputs in layers I, IV, and VI (gray areas) were directly compared with the experimental recordings of thalamic inputs in that cell. ii: Simulated EPSP/IPSP sequences and bursts after inversion of the chloride reversal potential. The model could match experiments only if both excitatory and inhibitory conductances were strong. iii: Calcium transients in the dendrites of the model following thalamic inputs. The membrane potential at the soma (top trace) consisted in an EPSP/IPSP sequence. However, representing the profile of calcium concentration (bottom trace) along a path from soma (left) to distal apical dendrite (*) shows large calcium transients in response to strong dendritic depolarization. [Modified from Contreras et al. (63).]

References

    1. Abel T, Nguyen PV, Barad M, Deuel TAS, Kandel ER, Bourtchouladze R. Genetic demonstration of a role for PKA in the late phase of LTP and in hippocampus-based long-term memory. Cell. 1997;88:615–626. - PubMed
    1. Adams DJ, Smith SJ, Thompson SH. Ionic currents in molluscan soma. Annu Rev Neurosci. 1980;3:141–167. - PubMed
    1. Adrian ED. Afferent discharges to the cerebral cortex from peripheral sense organs. J Physiol. 1941;100:159–191. - PMC - PubMed
    1. Ahlsen G, Grant K, Lindström S. Monosynaptic excitation of principal cells in the lateral geniculate nucleus by corticofugal fibers. Brain Res. 1982;234:454–458. - PubMed
    1. Albowitz B, Kuhnt U. Spread of epileptiform potentials in the neocortical slice: recordings with voltage-sensitive dyes. Brain Res. 1993;631:329–333. - PubMed

Publication types

LinkOut - more resources