Comparative Study
. 2003 Oct;85(4):2100-10.
doi: 10.1016/S0006-3495(03)74638-4.

Onset of DNA aggregation in presence of monovalent and multivalent counterions

Affiliations
Comparative Study

Onset of DNA aggregation in presence of monovalent and multivalent counterions

Yoram Burak et al. Biophys J. 2003 Oct.

Abstract

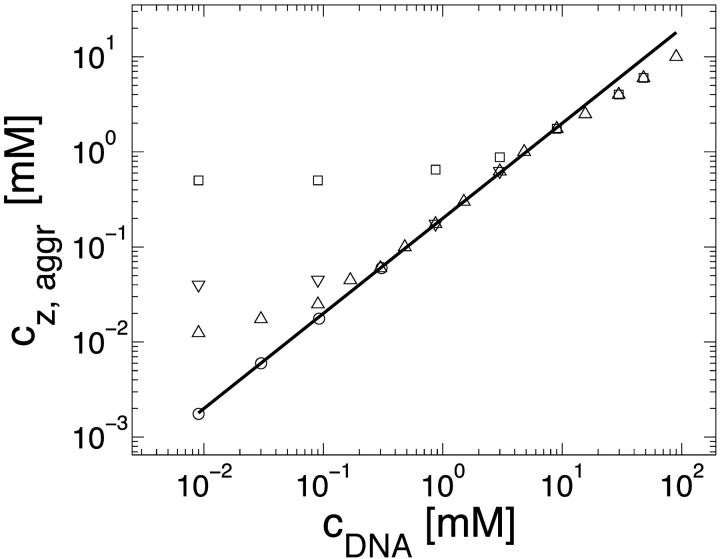
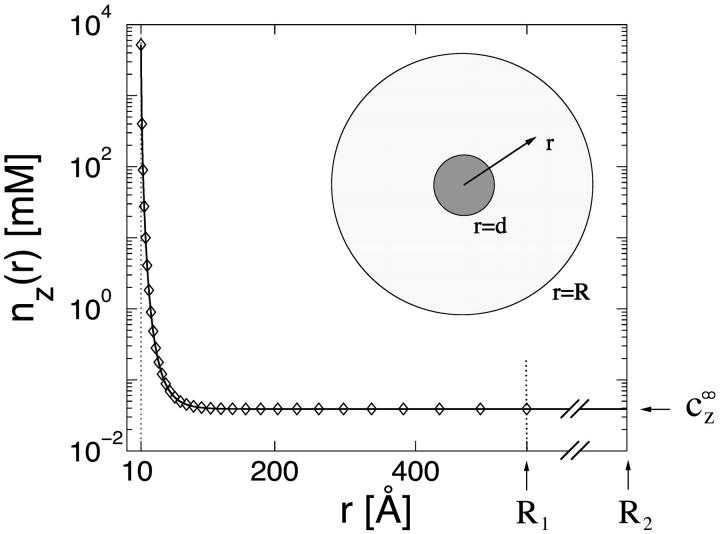
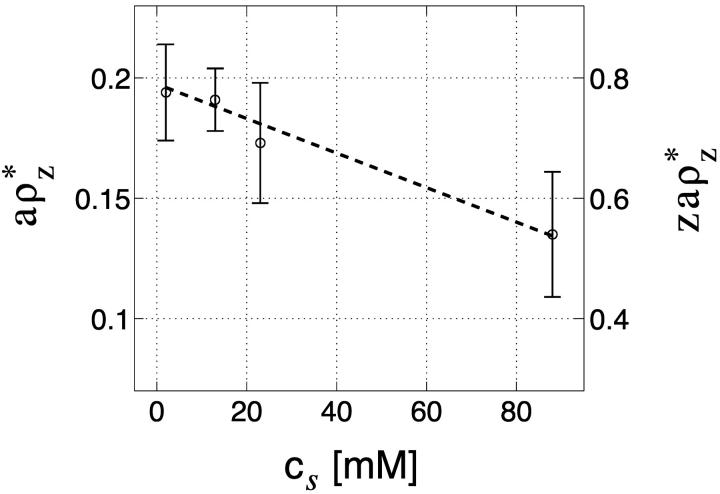
We address theoretically aggregation of DNA segments by multivalent polyamines such as spermine and spermidine. In experiments, the aggregation occurs above a certain threshold concentration of multivalent ions. We demonstrate that the dependence of this threshold on the concentration of DNA has a simple form. When the DNA concentration c(DNA) is smaller than the monovalent salt concentration, the threshold multivalent ion concentration depends linearly on c(DNA), having the form alphac(DNA) + beta. The coefficients alpha and beta are related to the density profile of multivalent counterions around isolated DNA chains, at the onset of their aggregation. This analysis agrees extremely well with recent detailed measurements on DNA aggregation in the presence of spermine. From the fit to the experimental data, the number of condensed multivalent counterions per DNA chain can be deduced. A few other conclusions can then be reached: 1), the number of condensed spermine ions at the onset of aggregation decreases with the addition of monovalent salt; 2), the Poisson-Boltzmann theory overestimates the number of condensed multivalent ions at high monovalent salt concentrations; and 3), our analysis of the data indicates that the DNA charge is not overcompensated by spermine at the onset of aggregation.


Figures

FIGURE 1
FIGURE 1
Percent of solubilized DNA, as function of polyamine concentration. Squares, spermine; circles, spermidine. Solid and dashed lines are guides for the eye. DNA and NaCl concentrations are 3 mM and 25 mM, respectively. Below the aggregation threshold, caggr, and above the redissolution threshold, credissol, all the DNA is dissolved. The data is adapted from Pelta et al. (1996b).
FIGURE 2
FIGURE 2
Spermine concentration, cz,aggr, at the onset aggregation, as a function of DNA monomer concentration cDNA. Data is shown for four monovalent salt concentrations: 2 mM (○); 13 mM (Δ); 23 mM (∇); and 88 mM (□). Solid line corresponds to the fixed ratio of cz,aggr/cDNA = 0.20. The data is adapted from Raspaud et al. (1998).
FIGURE 3
FIGURE 3
Schematic representation of the multivalent density profile, nz(r), between two neighboring DNA segments, each modeled as a cylinder of radius d. Here r is the distance from the axis of the left DNA strand. The radius r = R corresponds to the interstrand mid-distance and is the unit cell radius. The density decays to its bulk value formula image on distances larger than κ−1, where κ−1 is the Debye length defined in Eq. 1. The excess density of multivalent ions, ρz, is indicated by the shaded areas.
FIGURE 4
FIGURE 4
Density profile nz(r) of 4-valent ions as function of r, the distance from the DNA axis, on a semilog plot, calculated using the Poisson-Boltzmann equation in a cell model, where the DNA segment is modeled as a uniformly charged cylinder. The cell model is shown schematically in the inset. Two cell sizes are shown, with outer radii R1 = 560 Å (cDNA = 1 mM) and R2 = 1.8 × 10⁴ Å (cDNA = 10−3 mM), indicated by arrows. In both cases, the radius of closest approach of ions to the charged chain is at r = d, where d = 10 Å, as indicated by a dotted vertical line. The boundary condition at the inner cylinder matches the linear charge density of DNA (1e/1.7 Å). The bulk densities of monovalent and multivalent ions, formula image and formula image, are chosen to be the same in the two cells, leading to practically identical density profiles. The solid line represents the larger cell (R2), and diamonds are used for the smaller cell (R1). Density profiles of monovalent counterions and co-ions are not shown but are also practically identical in the two cells. Average salt concentrations are cs = 22 mM and cz = 0.21 mM in the smaller cell, and cs = 23 mM, cz = 0.039 mM in the larger cell. Bulk concentrations are formula image = 23 mM and formula image 0.039 mM. Note that these bulk concentrations are practically identical to the salt concentrations in the larger cell. Note also that formula image in the smaller cell, reflecting the contribution of the counterions released by the DNA.
FIGURE 5
FIGURE 5
Spermine concentration at the onset of aggregation cz,aggr as a function of cDNA, fitted to the form derived in Eq. 10 (different line types are used for different salt concentrations). Value of cs (in mM) is indicated next to each curve. Experimental data is adapted from Raspaud et al. (1998) and shown in the following symbols: cs = 2 mM (○); 13 mM (Δ); 23 mM (∇); and 88 mM (□). Experimental error bars (E. Raspaud, private communication) are indicated by vertical lines. The fitted lines and experimental points are shown using a linear scale in a, up to cDNA = 1.5 mM, and a log-log scale in b, up to cDNA = 100 mM, allowing all data points to be shown on the same plot. Only the data up to cDNA = 10 mM was used for the linear fit. The crossover values of cDNA, as defined by Eq. 14, are indicated by arrows in b.
FIGURE 6
FIGURE 6
Excess of multivalent counterions per monomer at the onset of aggregation, aρz*, as function of cs. All values are taken from Table 1, as extracted from the experimental data of Raspaud et al. (1998). Error bars are indicated by vertical bars and the dashed line is a linear fit to be used as a guide to the eye. On the right axis, zaρz* is shown, where z = 4 for spermine. This value is equal to the fraction of DNA charge compensated by the condensed multivalent ions. Note that, according to the Manning condensation theory, the same quantity is equal to 0.94, for tetravalent ions and no added salt.
FIGURE 7
FIGURE 7
Spermine concentration (in mM) as a function of DNA monomer concentration (mM) at the onset of aggregation, calculated using the PB equation. Two different criteria are used in a and b to determine the onset: in a, formula image, as calculated using the PB equation, is equal to the experimental value of cz* from Table 1. In b, ρz of PB theory is equal to ρz* from Table 1. The radius of DNA is taken as d = 10 Å. Log-log plot is used to show the five decades of DNA concentrations. For each cs the plot covers experimental data up to cDNA = cs. For larger cDNA, corrections due to changes in formula image should be taken into account, as was discussed in the preceding section. All notations are the same as in Fig. 5.
FIGURE 8
FIGURE 8
Excess of 4-valent ions per DNA monomer, up to a distance r from the axis of a charged cylinder of radius d = 10 Å (modeling the DNA) as obtained using the Poisson-Boltzmann equation (solid line). The excess δρz (r) is defined in Eq. A1. The number of charges per unit length on the cylinder is 1/a where a = 1.7 Å to fit DNA values. The bulk densities of monovalent and multivalent ions are formula image = 88 mM, formula image = 0.52 mM, yielding κ−1 = 10.0 Å. The quantity δρz (solid line) can be compared with the total number of 4-valent ions (dashed line) up to a distance r from the cylinder. The distance d + κ−1 from the DNA axis is indicated by a vertical arrow, and characterizes the decay of the density profile far away from the DNA.

References

    1. Andelman, D. 1994. Electrostatic properties of membranes: the Poisson-Boltzmann theory. In Handbook of Physics of Biological Systems, Vol. I. R. Lipowsky, and E. Sackmann, editors. Elsevier Science, Amsterdam, pp.603–642.
    1. Arenzon, J. J., J. F. Stilck, and Y. Levin. 1999. Simple model for attraction between like-charged polyions. Eur. Phys. J. B. 12:79–82.
    1. Belloni, L., M. Drifford, and P. Turq. 1984. Counterion diffusion in polyelectrolyte solutions. Chem. Phys. 83:147–154.
    1. Bloomfield, V. A., D. M. Crothers, and I. Tinoco. 2000. Nucleic Acids: Structures, Properties, and Functions. University Science Books, Sausalito, CA.
    1. Borukhov, I., R. F. Bruinsma, W. M. Gelbart, and A. J. Liu. 2001. Elastically driven linker aggregation between two semiflexible polyelectrolytes. Phys. Rev. Lett. 86:2182–2185. - PubMed

LinkOut - more resources