

Dynamic tension spectroscopy and strength of biomembranes
- PMID: 14507698
- PMCID: PMC1303459
- DOI: 10.1016/S0006-3495(03)74658-X
Dynamic tension spectroscopy and strength of biomembranes
Abstract
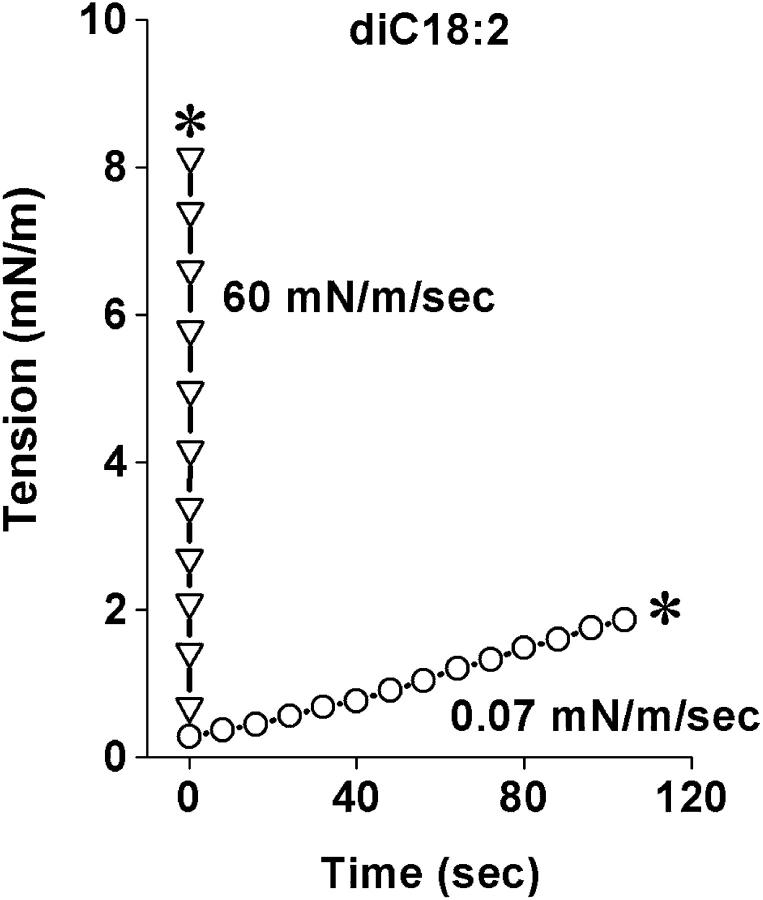
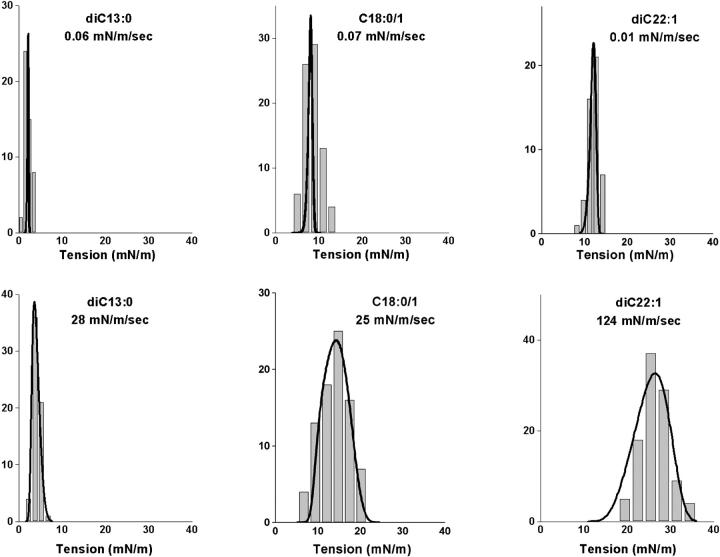
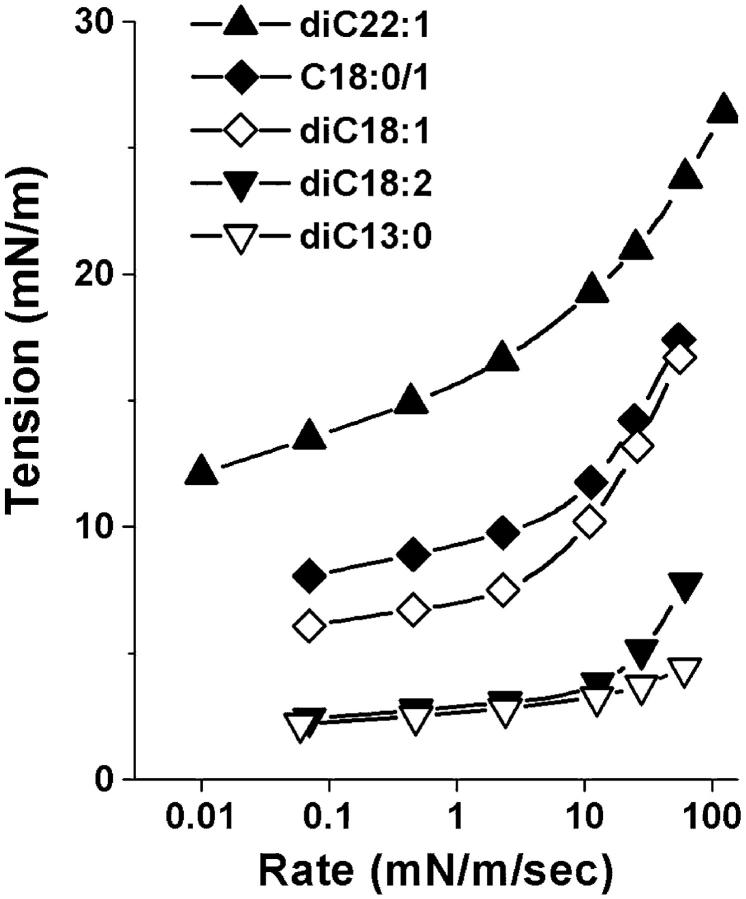
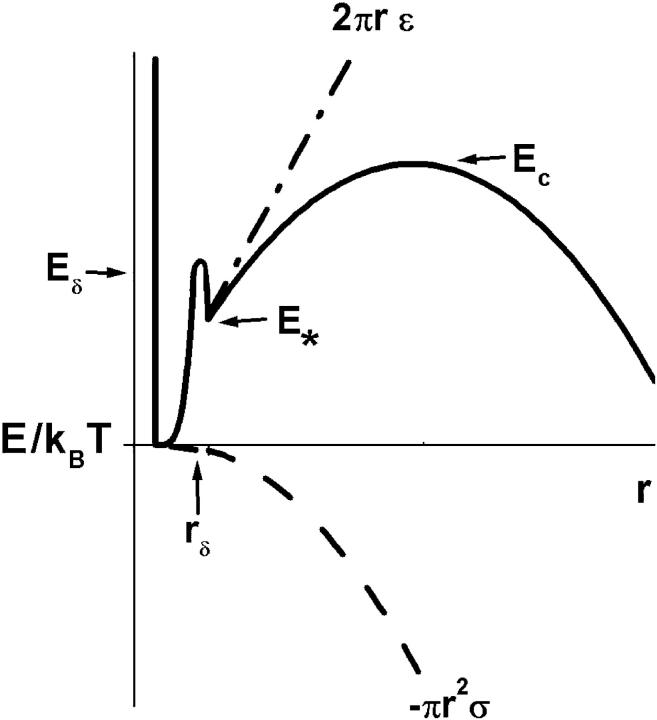
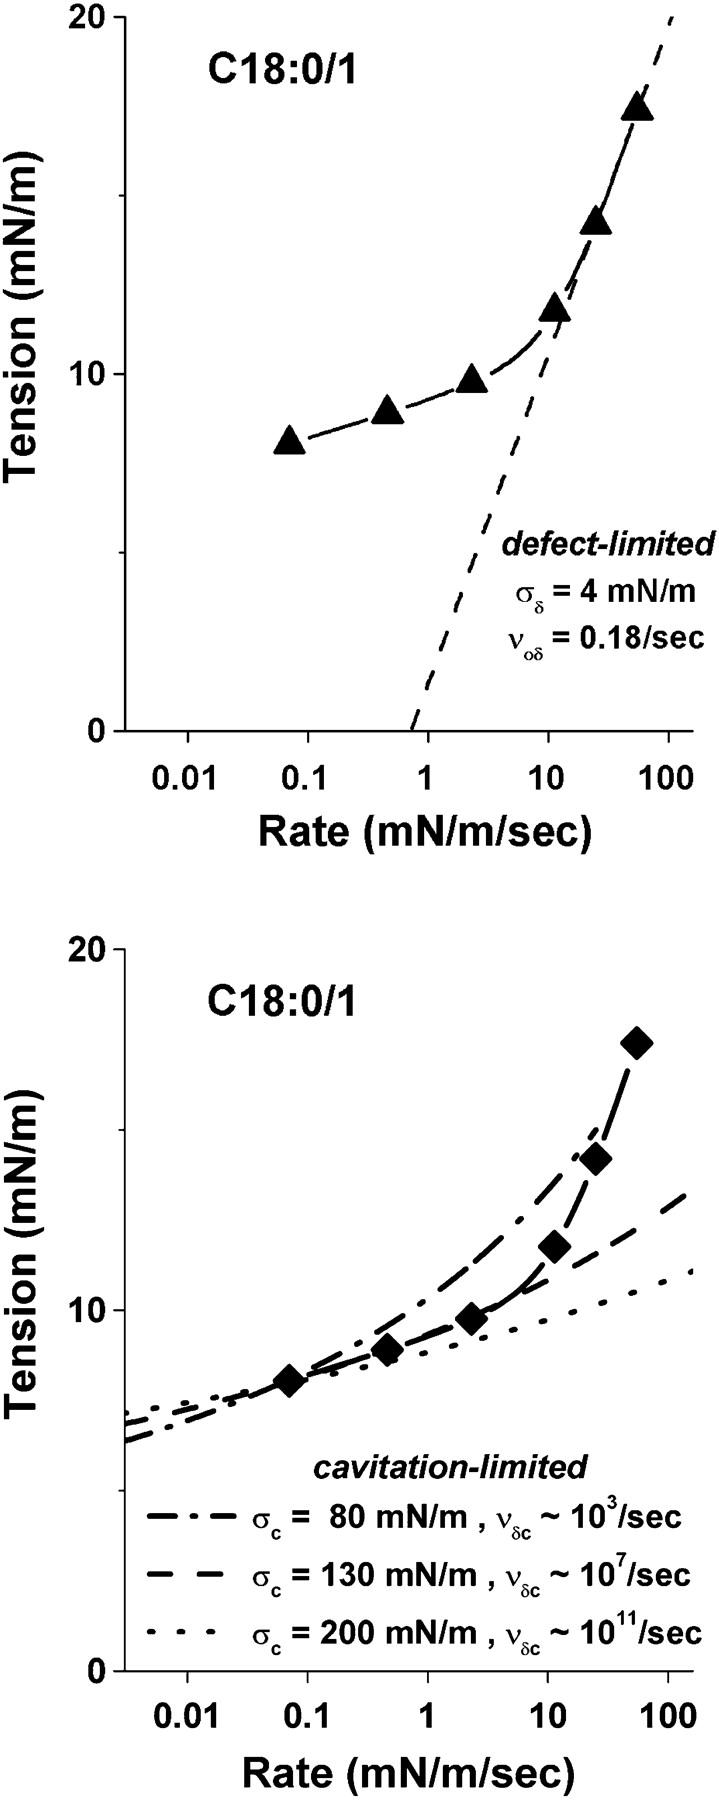
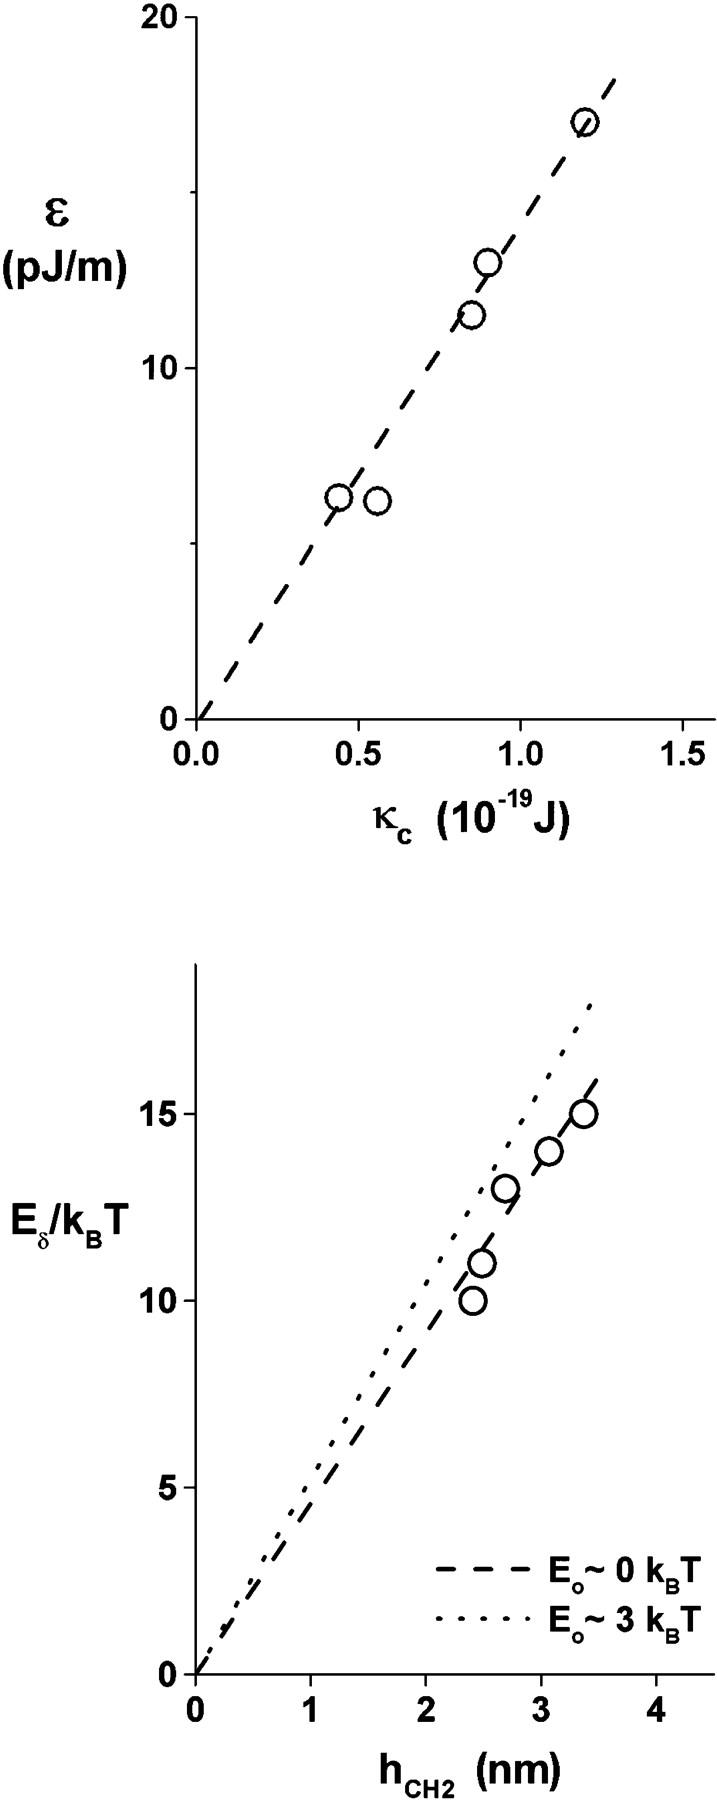
Rupturing fluid membrane vesicles with a steady ramp of micropipette suction produces a distribution of breakage tensions governed by the kinetic process of membrane failure. When plotted as a function of log(tension loading rate), the locations of distribution peaks define a dynamic tension spectrum with distinct regimes that reflect passage of prominent energy barriers along the kinetic pathway. Using tests on five types of giant phosphatidylcholine lipid vesicles over loading rates(tension/time) from 0.01-100 mN/m/s, we show that the kinetic process of membrane breakage can be modeled by a causal sequence of two thermally-activated transitions. At fast loading rates, a steep linear regime appears in each spectrum which implies that membrane failure starts with nucleation of a rare precursor defect. The slope and projected intercept of this regime are set by defect size and frequency of spontaneous formation, respectively. But at slow loading rates, each spectrum crosses over to a shallow-curved regime where rupture tension changes weakly with rate. This regime is predicted by the classical cavitation theory for opening an unstable hole in a two-dimensional film within the lifetime of the defect state. Under slow loading, membrane edge energy and the frequency scale for thermal fluctuations in hole size are the principal factors that govern the level of tension at failure. To critically test the model and obtain the parameters governing the rates of transition under stress, distributions of rupture tension were computed and matched to the measured histograms through solution of the kinetic master (Markov) equations for defect formation and annihilation or evolution to an unstable hole under a ramp of tension. As key predictors of membrane strength, the results for spontaneous frequencies of defect formation and hole edge energies were found to correlate with membrane thicknesses and elastic bending moduli, respectively.
Figures
References
-
- Abidor, I. G., V. B. Arakelyan, L. V. Chernomordik, Y. A. Chizmadzhev, V. F. Pastushenko, and M. R. Tarasevich. 1979. Electric breakdown of bilayer lipid membranes. I. The main experimental facts and their qualitative discussion. J. Electroanal. Chem. 104:37–52.
-
- Barnett, A., and J. Weaver. 1991. Electroporation: a unified, quantitative theory of reversible electrical breakdown and mechanical rupture in artificial planar bilayer membranes. Bioelectrochem. Bioenerg. 21:163–182.
-
- Bermudez, H., A. K. Brannan, D. A. Hammer, F. S. Bates, and D. E. Discher. 2002. Molecular weight dependence of polymersome membrane structure, elasticity, and stability. Macromolecules. 35:8203–8208.
-
- Bloom, M., E. Evans, and O. G. Mouritsen. 1991. Physical properties of the fluid lipid bilayer component of cell membranes. Quart. Rev. Biophys. 24:293–397. - PubMed
-
- Brochard-Wyart, F., P.-G. de Gennes, and O. Sandre. 2000. Transient pores in stretched vesicles: role of leak-out. Physica A. 278:32–51.
Publication types
MeSH terms
Substances
LinkOut - more resources
Full Text Sources
Other Literature Sources
Research Materials
