. 2003 Oct;85(4):2673-83.
doi: 10.1016/S0006-3495(03)74690-6.

Synthesis of voltage-sensitive fluorescence signals from three-dimensional myocardial activation patterns

Affiliations

Synthesis of voltage-sensitive fluorescence signals from three-dimensional myocardial activation patterns

Christopher J Hyatt et al. Biophys J. 2003 Oct.

Abstract

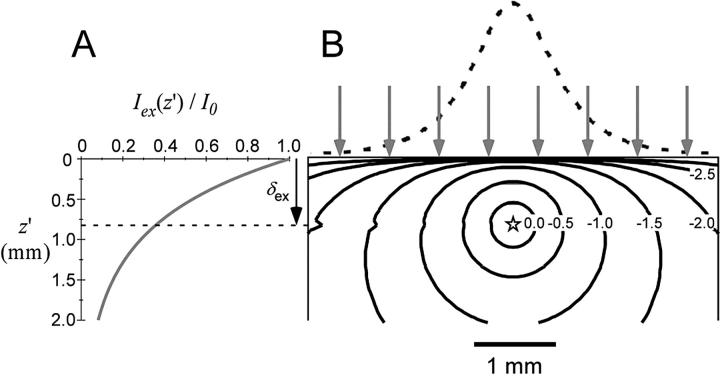
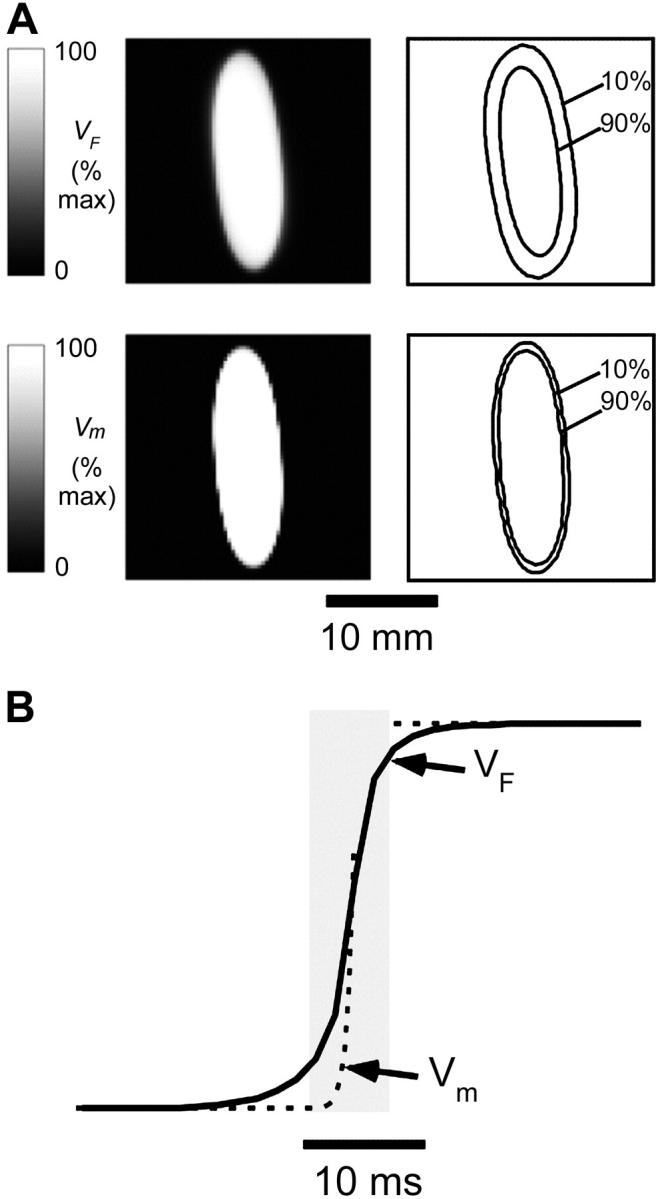
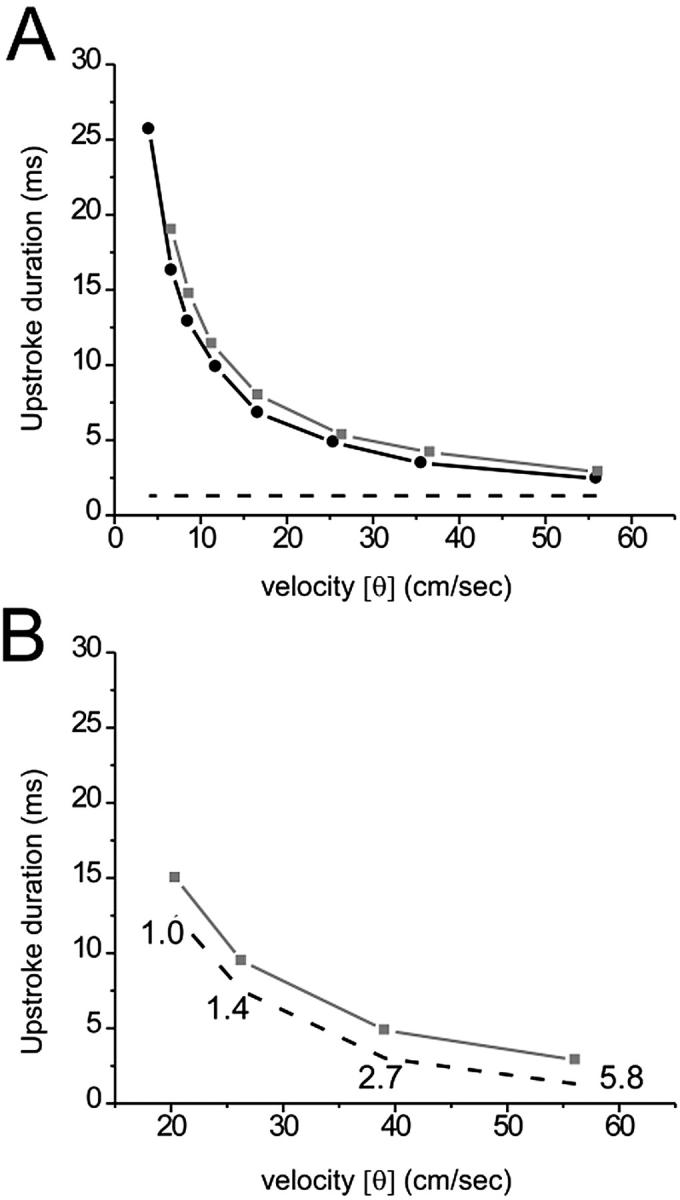
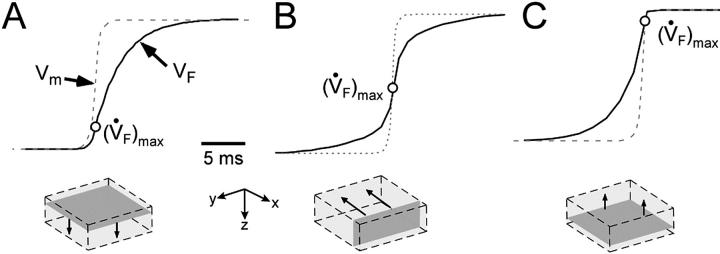
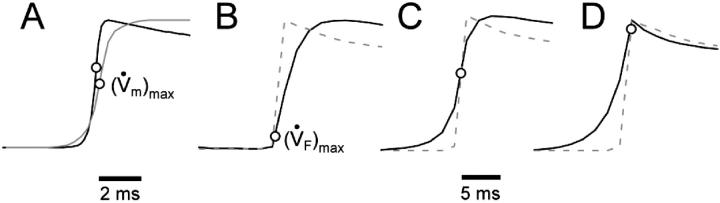
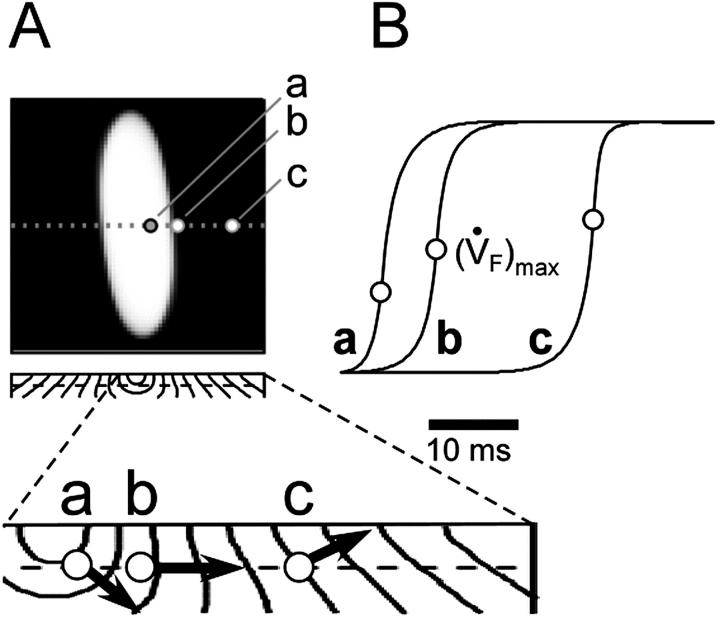
Voltage-sensitive fluorescent dyes are commonly used to measure cardiac electrical activity. Recent studies indicate, however, that optical action potentials (OAPs) recorded from the myocardial surface originate from a widely distributed volume beneath the surface and may contain useful information regarding intramural activation. The first step toward obtaining this information is to predict OAPs from known patterns of three-dimensional (3-D) electrical activity. To achieve this goal, we developed a two-stage model in which the output of a 3-D ionic model of electrical excitation serves as the input to an optical model of light scattering and absorption inside heart tissue. The two-stage model permits unique optical signatures to be obtained for given 3-D patterns of electrical activity for direct comparison with experimental data, thus yielding information about intramural electrical activity. To illustrate applications of the model, we simulated surface fluorescence signals produced by 3-D electrical activity during epicardial and endocardial pacing. We discovered that OAP upstroke morphology was highly sensitive to the transmural component of wave front velocity and could be used to predict wave front orientation with respect to the surface. These findings demonstrate the potential of the model for obtaining useful 3-D information about intramural propagation.


Figures

FIGURE 1
FIGURE 1
Optical characteristics of cardiac tissue. (A) Intramural exponential decay of excitation light in the case of uniform green (520 nm) illumination. (B) Contours of equal photon concentration, Φ (solid lines), determined using Eq. 6 (logarithmic scale, value on contours indicate power of 10), due to a point source (emission, 630 nm) of unity strength located at a depth of 0.8 mm. Also shown is the emitted light intensity profile at the heart surface due to the point source (dashed line). The arrows indicate uniform illumination of the heart surface.
FIGURE 2
FIGURE 2
Simulated optical recordings of electrical activity after epicardial point stimulation (t = 19 ms). (A) Top left, Snapshot of voltage-dependent fluorescence VF; top right, corresponding map showing 10% and 90% (of maximum) fluorescence contours. Bottom left, snapshot of the surface distribution of the transmembrane potential Vm; bottom right, corresponding map showing 10% and 90% (of maximum) isopotential lines. (B) Upstrokes of the optical (solid) and electrical (dashed) action potentials obtained from the same epicardial site.
FIGURE 3
FIGURE 3
Optical and electrical upstroke duration as a function of plane wave conduction velocity (CV). (A) Here, CV was set by varying the electrical coupling in the direction of propagation. The plot depicts OAP upstroke duration for plane wave propagation in the transmural direction (black line, solid circle), away from the mapped surface, and lateral direction (gray line, solid box), perpendicular to the mapped surface. Electrical upstroke duration was the same for both cases (dashed line). (B) Here, plane wave CV was set by varying the fast inward current. The plot depicts OAP (gray line, solid box) and electrical (dashed line) upstroke duration for plane wave propagation in the lateral direction only. Fast inward channel conductance (mmho/cm2) is indicated near each corresponding data point.
FIGURE 4
FIGURE 4
OAP upstroke morphology as a function of the direction of transmural propagation (see diagrams below each plot). (A) Propagation away from the recording surface; (B) propagation perpendicular to the recording surface; and (C) propagation toward the recording surface. Open circles on the OAP upstrokes indicate (the Fenton-Karma ionic model) locations of (formula image)max. Electrical upstrokes are indicated by dashed lines.
FIGURE 5
FIGURE 5
OAP upstroke morphology as a function of the direction of transmural propagation (using the LR-1 ionic model). (A) Comparison of the electrical upstrokes for the Fenton-Karma (gray) and LR-1 (black) ionic models. Open circles on the electrical upstrokes indicate approximate locations of (formula image)max. (B) Plane waves directed away from the recording surface; (C), propagation perpendicular to the recording surface; and (D), propagation toward the recording surface. Open circles on the OAP upstrokes indicate locations of (formula image)max. Electrical upstrokes are shown by dashed lines.
FIGURE 6
FIGURE 6
Spatial variation in epicardial OAP upstroke morphology after point stimulation; (A) Epicardial snapshot of voltage-dependent fluorescence VF (top, snapshot dimension: 22 × 22 mm). Transmural (middle) and zoomed transmural (bottom) isochrone maps (5-ms intervals; map dimensions: 22 × 2 mm). The position of the transmural slice is indicated by dotted line in epicardial snapshot. Dashed line in transmural map is located 1 mm beneath the epicardium and represents the depth from which most of the optical signal originates. Sites a, b, and c are indicated (top), and the approximate net transmural wave front direction at each of these sites is shown by an arrow in the zoomed version of the transmural slice isochrone map (bottom). (B) The corresponding OAP upstroke morphology at sites a, b. and c. Open circles on the OAP upstrokes indicate locations of (formula image)max.

References

    1. Armour, J. A., and W. C. Randall. 1970. Structural basis for cardiac function. Am. J. Physiol. 218:1517–1523. - PubMed
    1. Baxter, W. T., J. M. Davidenko, L. M. Loew, J. P. Wuskell, and J. Jalife. 1997. Technical features of a CCD video camera system to record cardiac fluorescence data. Ann. Biomed. Eng. 25:713–725. - PubMed
    1. Baxter, W. T., S. F. Mironov, A. V. Zaitsev, J. Jalife, and A. M. Pertsov. 2001. Visualizing excitation waves inside cardiac muscle using transillumination. Biophys. J. 80:516–530. - PMC - PubMed
    1. Berenfeld, O., and A. M. Pertsov. 1999. Dynamics of intramural scroll waves in three-dimensional continuous myocardium with rotational anisotropy. J. Theor. Biol. 199:383–394. - PubMed
    1. Choi, B. R., and G. Salama. 1998. Optical mapping of atrioventricular node reveals a conduction barrier between atrial and nodal cells. Am. J. Physiol. 274:H829–H845. - PubMed

Publication types

MeSH terms

Substances

LinkOut - more resources