

Development of a clinically feasible logMAR alternative to the Snellen chart: performance of the "compact reduced logMAR" visual acuity chart in amblyopic children
- PMID: 14507755
- PMCID: PMC1920770
- DOI: 10.1136/bjo.87.10.1232
Development of a clinically feasible logMAR alternative to the Snellen chart: performance of the "compact reduced logMAR" visual acuity chart in amblyopic children
Abstract
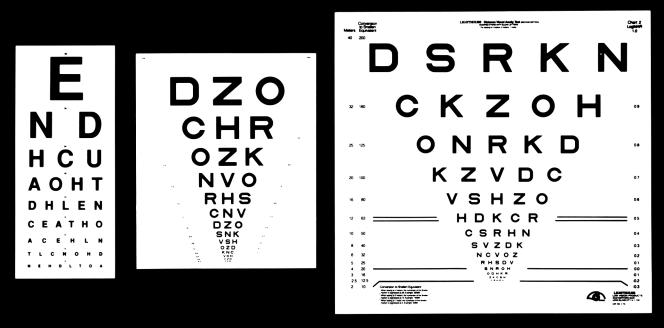
Background/aim: The "compact reduced logMAR" (cRLM) chart is being developed as a logMAR alternative to the Snellen chart. It is closer spaced and has fewer letters per line than conventional logMAR charts. Information regarding the performance of such a chart in amblyopes and children is therefore required. This study aimed to investigate the performance of the cRLM chart in amblyopic children.
Methods: Timed test and retest measurements using two versions of each chart design were obtained on the amblyopic eye of 43 children. Using the methods of Bland and Altman the agreement, test-retest variability (95% confidence limits for agreement, TRV) and test time of the cRLM and the current clinical standard Snellen chart were compared to the gold standard ETDRS logMAR chart.
Results: No systematic bias between chart designs was found. For line assignment scoring the respective TRVs were 0.20 logMAR, 0.20 logMAR, and 0.30 logMAR. Single letter scoring TRVs were cRLM (95% CL 0.17) logMAR, ETDRS (95% CL 0.14) logMAR, and Snellen (95% CL 0.29) logMAR. Median testing times were ETDRS 60 seconds, cRLM 40 seconds, Snellen 30 seconds.
Conclusion: The sensitivity to change of the cRLM equalled or approached that of the gold standard ETDRS and was at least 50% better than that of Snellen. This enhanced sensitivity to change was at the cost of only a 10 second time penalty compared to Snellen. The cRLM chart was approximately half the width of the ETDRS chart. The cRLM chart may represent a clinically acceptable compromise between the desire to obtain logMAR acuities of reasonable and known sensitivity to change, chart size, and testing time.
Figures
References
-
- Bailey I, Lovie J. New design principles for visual acuity letter charts. Am J Optom Physiol Opt 1976;53:740–5. - PubMed
-
- Elliott DB, Sheridan M. The use of accurate visual acuity measurements in clinical anti-cataract formulation trials. Ophthalmic Physiol Opt 1988;8:397–401. - PubMed
-
- Ferris FL, Kassoff A, Bresnick GH, et al. New visual acuity charts for clinical research. Am J Ophthalmol 1982;94:91–6. - PubMed
-
- Sloan LL. New test charts for the measurement of visual acuity at near and far distances. Am J Ophthalmol 1959;48:807–13. - PubMed
MeSH terms
LinkOut - more resources
Full Text Sources
Medical