Comparative Study
. 2003 Oct;44(10):4489-96.
doi: 10.1167/iovs.03-0041.

Selective uptake of indocyanine green by reticulocytes in circulation

Affiliations
Comparative Study

Selective uptake of indocyanine green by reticulocytes in circulation

Xunbin Wei et al. Invest Ophthalmol Vis Sci. 2003 Oct.

Abstract

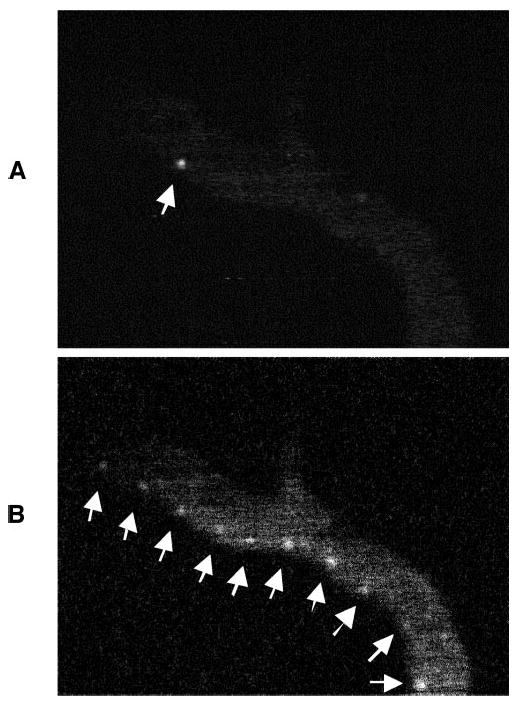
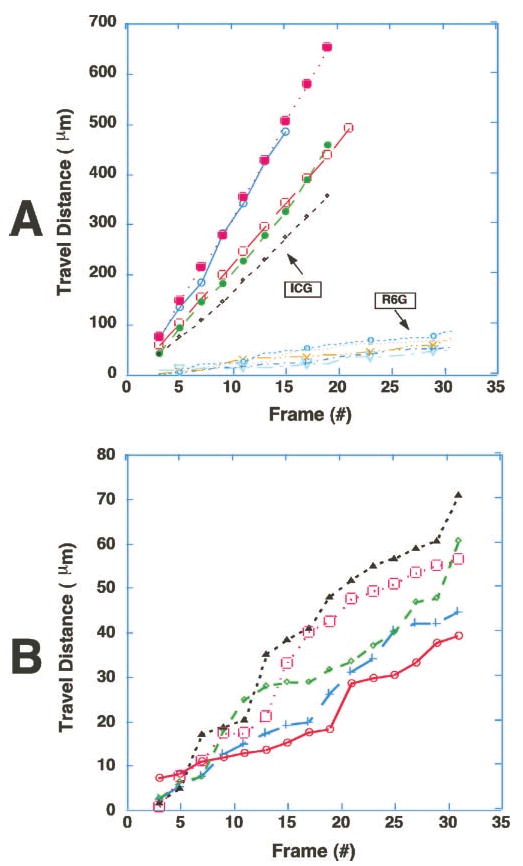
Purpose: Hyperfluorescent cells labeled with indocyanine green (ICG) have been observed in retinal and choroidal circulation using scanning laser ophthalmoscopy. It has been suggested that ICG labels leukocytes and that ICG can be used to track leukocyte movement in vivo. The purpose of this study is to identify the cell population that takes up ICG and to study their trafficking pattern in vivo by confocal fluorescence microscopy.

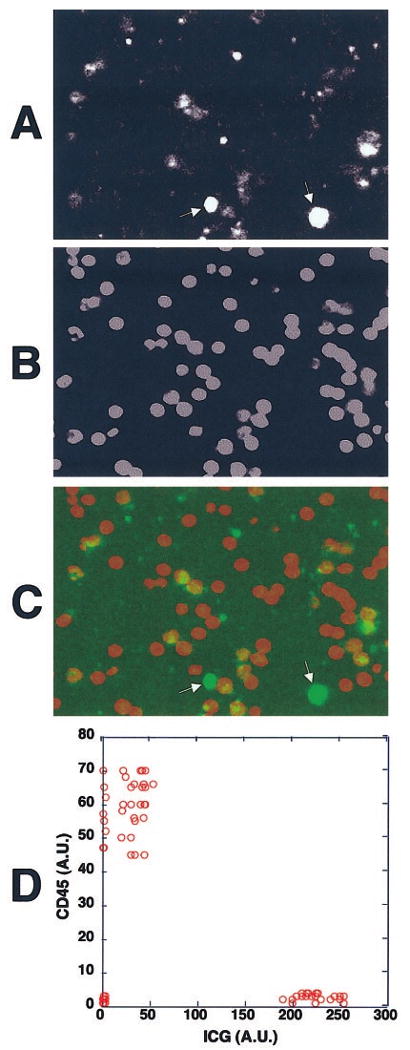
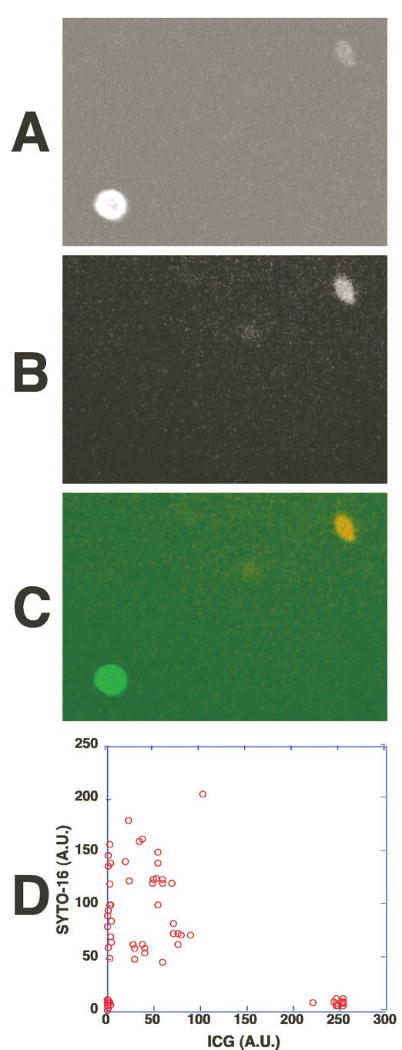
Methods: ICG was injected into the mouse tail vein, and images were taken by in vivo confocal microscopy. The trafficking pattern of ICG-labeled cells was compared with that of rhodamine 6G-labeled leukocytes. In vitro labeling of human blood cells with antibodies against cell lineage markers and with DNA stains was further used to identify the ICG-labeled cells. Antibodies against the following cell surface markers were used: CD45 (leukocytes), CD3 (T lymphocytes), CD19 (B lymphocytes), CD16 (Fc receptor), glycophorin A (erythroid lineage cells), and CD71 (transferrin receptor).

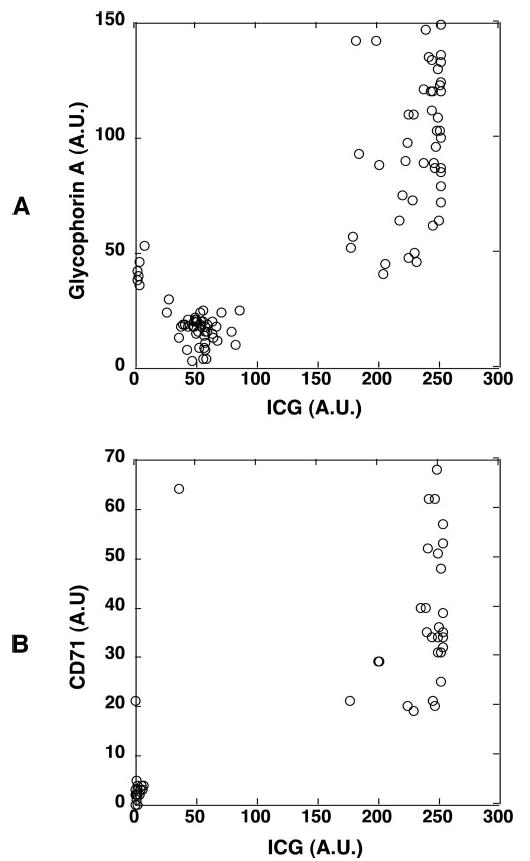
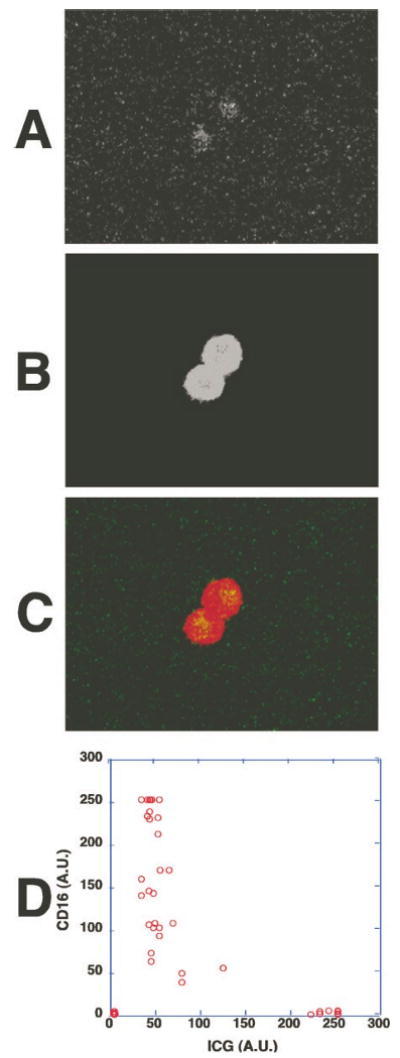
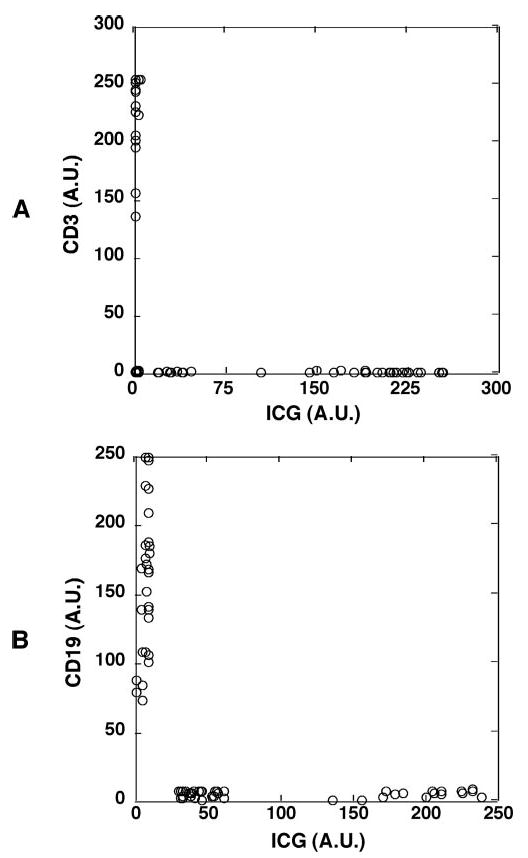
Results: The ICG-labeled cells were made up of two blood cell populations with distinct levels of ICG uptake. The strongly ICG-labeled cells did not roll on dermal vascular endothelium in vivo, in contrast to rhodamine 6G-labeled leukocytes. They were identified as reticulocytes because antibody staining showed that they were CD 45(-), glycophorin A(+) and CD 71(+). The weakly ICG-labeled cells were identified as neutrophils because they were CD45(+), CD16(+), CD3(-), and CD19(-).

Conclusions: ICG strongly labels reticulocytes and weakly labels neutrophils. To the authors' knowledge, this is the first report of selective staining of reticulocytes by ICG.


Conflict of interest statement

Disclosure: X. Wei, None; J.M. Runnels, None; C.P. Lin, None

Figures

Figure 1
Figure 1
R6G (A) and ICG (B) photomicrographs showed that R6G and ICG labeled two different cell populations in vivo, as observed by in vivo confocal two-photon microscopy. R6G and ICG were injected into the same mouse, and the dermal blood vessels of the mouse ear were examined. R6G-stained leukocytes that appeared in the blood vessel (A, arrows) had no detectable level of ICG (B, arrows).
Figure 2
Figure 2
Time course of the movement of the ICG hyperfluorescent cell (arrows) through the dermal vasculature. The movement of an ICG-hyperfluorescent cell (A) was evaluated by tracking through a sequence of video frames (B) taken with an in vivo confocal microscope.
Figure 3
Figure 3
Trafficking patterns of ICG-hyperfluorescent cells were significantly different from those of R6G-stained leukocytes. The time course of spatial positions of five ICG-hyperfluorescent cells and five R6G-stained leukocytes were plotted from video records (30 frame/sec). Note that the ICG-hyperfluorescent cells were moving much faster than R6G-stained leukocytes (A). Furthermore, they were not sticking or rolling on the walls of the blood vessels, in contrast to R6G-stained leukocytes. (B) Expanded plot of the R6G-stained cells in (A), showing characteristic stepwise movement of leukocytes. Video clips of (A) and (B) are available at http://www.iovs.org/cgi/content/full/44/10/4489/DC1.
Figure 4
Figure 4
The strongly ICG-labeled cells were CD45, and the weakly ICG-fluorescent ones were CD45+. Human whole peripheral blood was incubated with ICG, and the buffy coat fraction containing the leukocytes was isolated. They were then stained with biotinylated anti-CD45 mAb and cy5-tagged streptavidin for examination under the confocal fluorescence microscope. (A) The ICG fluorescence of the cells from the WBC fraction. There were two ICG-fluorescent cell populations, one with strong ICG uptake (arrows) and one with weak ICG uptake. (B) The CD45 staining of the cells shown in (A). (C) An overlay fluorescence image of ICG (green) and CD45 staining (red). The strongly ICG-fluorescent cells were CD45 and the weakly fluorescent ones were CD45+. (D) The fluorescence intensities of ICG and cy5-tagged anti-CD45 mAb in each cell were measured and shown in a two-parameter dot plot. Similar results were obtained when whole peripheral blood was incubated with ICG and stained with cy5-tagged anti-CD45 mAb. AU, arbitrary units.
Figure 5
Figure 5
The strongly ICG-labeled cells did not contain DNA and the weakly ICG-fluorescent cells contained DNA and nuclei. Human whole peripheral blood was incubated with ICG for 1 hour and then stained with a cell-permeating nuclear dye (SYTO-16, Molecular Probes). The fluorescence of ICG and the dye in the cells was examined under the fluorescence microscope. (A) ICG fluorescence of the cells in whole peripheral blood. (B) The DNA staining of the cells shown in (A); 488-nm excitation and 535-nm emission were selected for DNA staining from the nuclear dye's fluorescence. (C) An overlay fluorescence image of ICG (green) and the nuclear dye (red). The strongly ICG-fluorescent cell was SYTO-16 negative, indicating the absence of DNA. A weakly ICG-fluorescent cell contained DNA and a nucleus. (D) The fluorescence intensities of ICG and SYTO-16 fluorescence in each cell were measured and shown in a two-parameter dot plot.
Figure 6
Figure 6
The strongly ICG-fluorescent cells were reticulocytes. Human whole peripheral blood was incubated with ICG for 1 hour and stained with anti-glycophorin A mAb (PE) or anti-CD71 mAb (cy5). The fluorescence of ICG and fluorophore-labeled mAbs of the cells were examined. (A) The fluorescence intensities of ICG- and PE-conjugated anti-glycophorin mAb in each cell were measured and shown in a two-parameter dot plot. The presence of glycophorin A on the strongly ICG-labeled cells indicated their erythroid cell lineage. (B) The fluorescence intensities of ICG and cy5-conjugated anti-CD71 mAb in each cell were measured and shown in a two-parameter dot plot. The presence of CD71 marker further indicated that the strongly ICG-labeled cells were reticulocytes. Similar results were obtained when whole peripheral blood was incubated with ICG, and the leukocytes were isolated, stained with both mAbs, and then examined.
Figure 7
Figure 7
CD16, a membrane marker for neutrophils and NK cells, was present on the weakly ICG-fluorescent cells. Human whole peripheral blood was incubated with ICG for 1 hour and then stained with cy5-conjugated anti-CD16 mAb. (A) ICG fluorescence of the cells from whole peripheral blood examined by fluorescence microscopy. (B) Cy5-conjugated anti-CD16 mAb staining of the cells shown in (A). (C) An overlay fluorescence image of ICG (green) and CD16 (red). The weakly ICG-fluorescent cells were CD16+. (D) The fluorescence intensities of ICG and CD16 staining in each cell were measured and shown in a two-parameter dot plot. Similar results were obtained when whole peripheral blood was incubated with ICG and the buffy coat fraction containing leukocytes was isolated, stained with anti-CD16 mAb, and examined.
Figure 8
Figure 8
The weakly ICG-fluorescent cells were confirmed to be neither T lymphocytes nor B lymphocytes. Human whole peripheral blood was incubated with ICG for 1 hour, and the buffy coat fraction containing leukocytes was isolated and stained with mAb against the T lymphocyte marker CD3 or with mAb against the B lymphocyte marker CD19. (A) The weakly ICG fluorescent cells were CD3, thus not T lymphocytes. The fluorescence intensities of ICG and cy5-conjugated anti-CD3 mAb in each cell were measured and shown in a two-parameter dot plot. (B) The weakly ICG-fluorescent cells were CD19, thus not B lymphocytes. The fluorescence intensities of ICG and cy5-conjugated anti-CD19 mAb in each cell were measured and shown in a two-parameter dot plot. Similar results were obtained when whole peripheral blood was incubated with ICG and stained with both mAbs.

References

    1. Slakter JS, Yannuzzi LA, Guyer DR, Sorenson JA, Orlock DA. Indocyanine-green angiography. Curr Opin Ophthalmol. 1995;6:25–32. - PubMed
    1. Destro M, Puliafito CA. Indocyanine green videoangiography of choroidal neovascularization. Ophthalmology. 1989;96:846–853. - PubMed
    1. Stanga PE, Lim JI, Hamilton P. Indocyanine green angiography in chorioretinal diseases: indications and interpretation: an evidence-based update. Ophthalmology. 2003;110:15–21. quiz 22-13. - PubMed
    1. Su MY, Lin DY, Sheen IS, Chu CM, Chiu CT, Liaw YF. Indocyanine green clearance test in non-cirrhotic hepatitis patients: a comparison and analysis between conventional blood sampling method and Finger Piece Monitoring method [in Chinese] Changgeng Yi Xue Za Zhi. 1999;22:17–23. - PubMed
    1. Ott P, Keiding S, Bass L. Intrinsic hepatic clearance of indocyanine green in the pig: dependence on plasma protein concentration. Eur J Clin Invest. 1992;22:347–357. - PubMed

Publication types