. 2003 Sep 24;23(25):8692-700.
doi: 10.1523/JNEUROSCI.23-25-08692.2003.

Interleukin-1beta enhances NMDA receptor-mediated intracellular calcium increase through activation of the Src family of kinases

Affiliations

Interleukin-1beta enhances NMDA receptor-mediated intracellular calcium increase through activation of the Src family of kinases

B Viviani et al. J Neurosci. .

Abstract

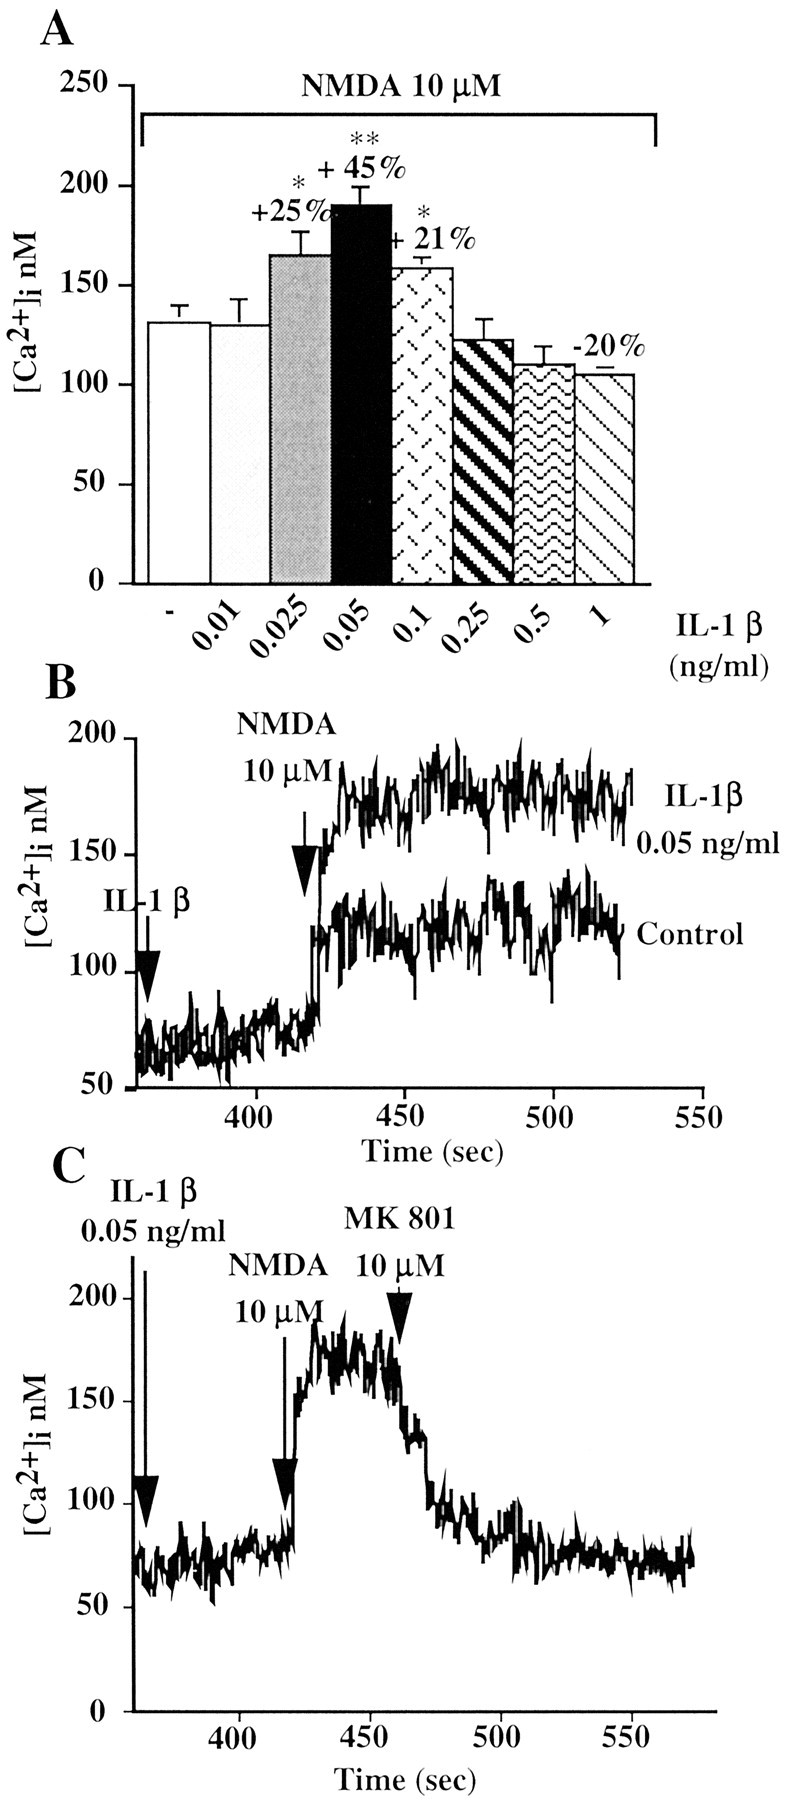
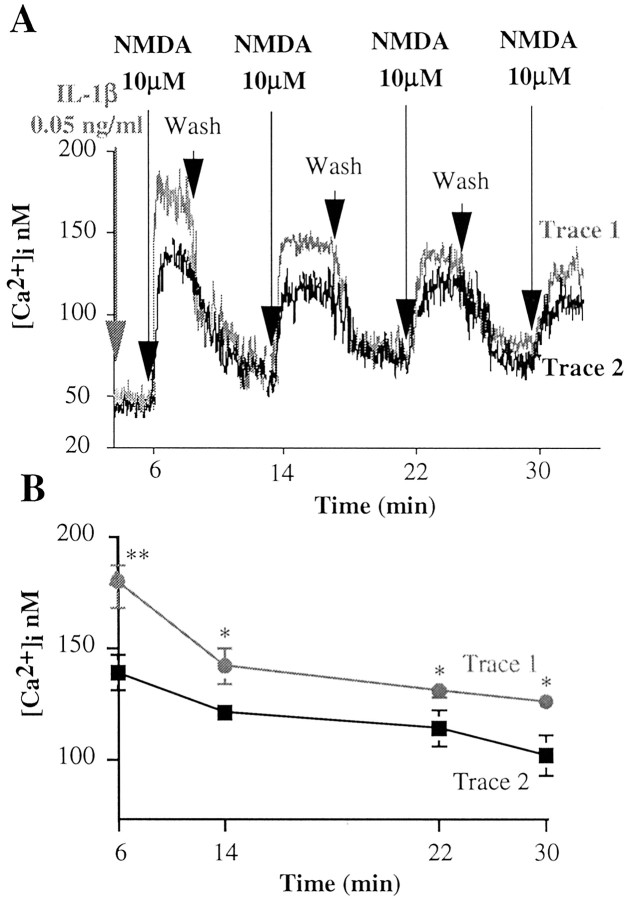
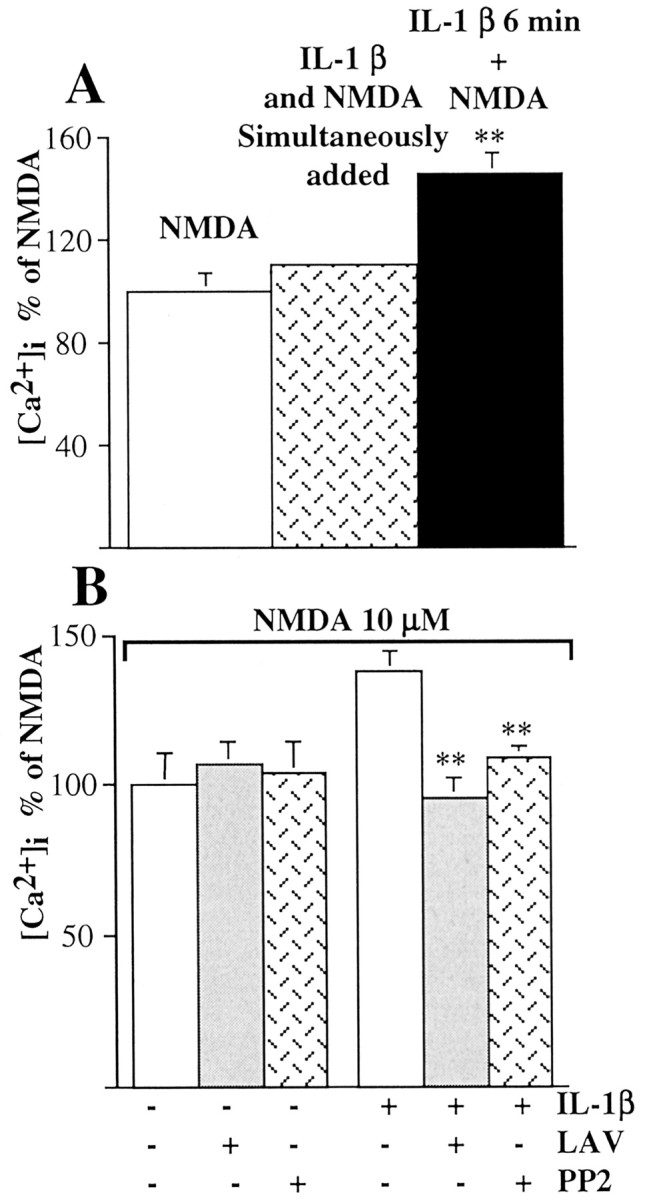
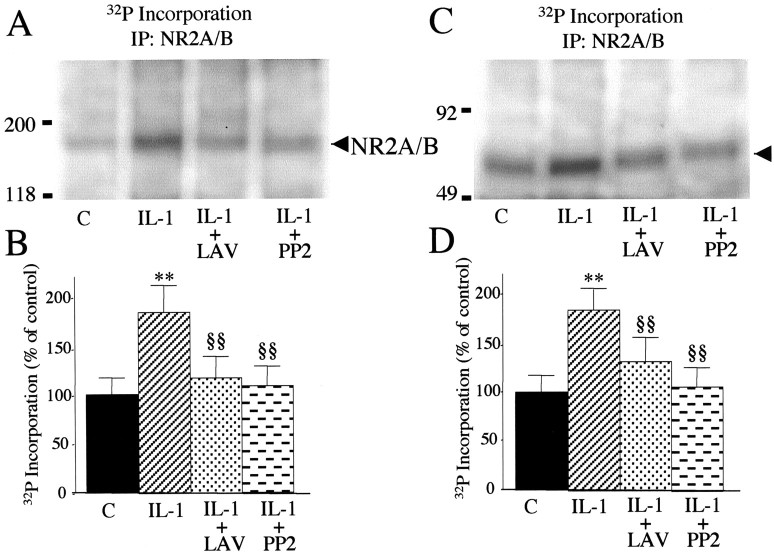
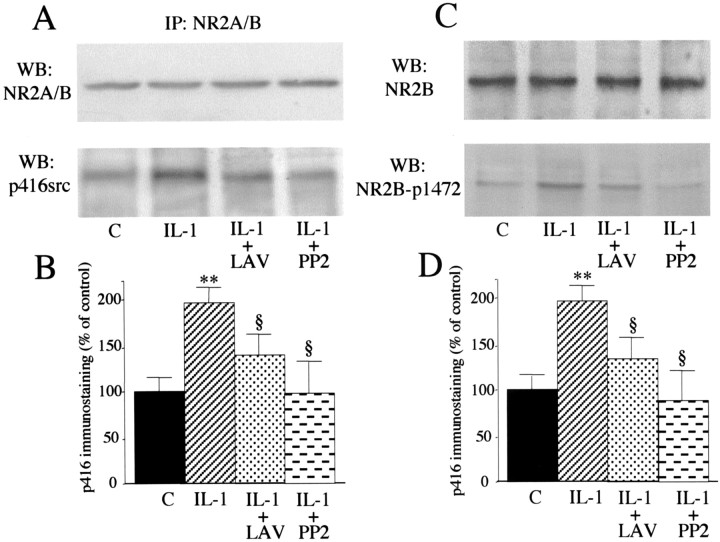
Interleukin (IL)-1beta is a proinflammatory cytokine implicated in various pathophysiological conditions of the CNS involving NMDA receptor activation. Circumstantial evidence suggests that IL-1beta and NMDA receptors can functionally interact. Using primary cultures of rat hippocampal neurons, we investigated whether IL-1beta affects NMDA receptor function(s) by studying (1) NMDA receptor-induced [Ca2+]i increase and (2) NMDA-mediated neurotoxicity. IL1beta (0.01-0.1 ng/ml) dose-dependently enhances NMDA-induced [Ca2+]i increases with a maximal effect of approximately 45%. This effect occurred only when neurons were pretreated with IL-1beta, whereas it was absent if IL-1beta and NMDA were applied simultaneously, and it was abolished by IL-1 receptor antagonist (50 ng/ml). Facilitation of NMDA-induced [Ca2+]i increase by IL-1beta was prevented by both lavendustin (LAV) A (500 nm) and 4-amino-5-(4-chlorophenyl)-7-(t-butyl)pyrazolo[3,4-d]pyrimidine (PP2) (1 microm), suggesting an involvement of tyrosine kinases. Increased tyrosine phosphorylation of NMDA receptor subunits 2A and 2B and coimmunoprecipitation of activated Src tyrosine kinase with these subunits was observed after exposure of hippocampal neurons to 0.05 ng/ml IL-1beta. Finally, 0.05 ng/ml IL-1beta increased by approximately 30% neuronal cell death induced by NMDA, and this effect was blocked by both lavendustin A and PP2. These data suggest that IL-1beta increases NMDA receptor function through activation of tyrosine kinases and subsequent NR2A/B subunit phosphorylation. These effects may contribute to glutamate-mediated neurodegeneration.


Figures

Figure 1.
Figure 1.
IL-1β effect on NMDA-induced [Ca2+]i increase in primary cultures of hippocampal neurons. A, Bar graph represents the average peak Ca2+ response to the application of 10 μm NMDA alone or in the presence of increasing concentration of IL-1β. Values are the mean ± SE of 7-13 independent samples. Percentage values represent the IL-1β effect expressed as percentage increase (+) or decrease (-) of the NMDA response measured in the absence of IL-1β. Hippocampal neurons were exposed to IL-1β (0.01-1 ng/ml) for 6 min and subsequently stimulated with 10 μm NMDA. [Ca2+]i increase was determined by loading hippocampal neurons with fura-2 AM and measuring fura-2 fluorescence ratio signal in a double-wavelength fluorimeter. **p < 0.01; *p < 0.05 versus NMDA alone; ANOVA followed by Tukey's test. B, Representative Ca2+ traces showing the response of hippocampal neurons exposed to 10 μm NMDA alone or with 6 min pretreatment with 0.05 ng/ml IL-1β. C, Representative Ca2+ trace showing the rapid decay in the response of hippocampal neurons when 10 μm MK801 was applied 1.5 min after NMDA stimulation. Neurons were exposed for 6 min to 0.05 ng/ml IL-1β and then stimulated with 10 μm NMDA.
Figure 2.
Figure 2.
Duration of the IL-1β effect on NMDA-induced [Ca2+]i increase. A, Trace 1 (gray) depicts a representative Ca2+ trace showing the response of hippocampal neurons to four consecutive applications of 10 μm NMDA, the first in the presence (6 min preincubation) and the following in the absence of 0.05 ng/ml IL-1β. Trace 2 (black) depicts a representative Ca2+ trace showing the response of hippocampal neurons to four consecutive applications of 10 μm NMDA done in the absence of IL-1β. Intracellular Ca2+ increase was determined by loading hippocampal neurons with fura-2 AM and measuring fura-2 fluorescence ratio signal in a double-wavelength fluorimeter. B, Average peak Ca2+ response to four consecutive applications of NMDA as reported in A. Values are the mean ± SE of 13 independent samples. **p < 0.01 and *p < 0.05 versus control; ANOVA followed by Tukey's test.
Figure 3.
Figure 3.
Immunofluorescence of IL-1RI and NR2A/B subunits of the NMDA receptor in primary cultures of hippocampal neurons. Detection of IL-1RI and NR2A/B subunits was obtained by double immunostaining with specific antibodies (see Materials and Methods) and AlexaFluor-conjugated secondary antibodies. Images were collected on a Delta Vision Optical Sectioning Microscope. IL-1RI and NR2A/B subunits are localized on the same neurons and showed a similar distribution pattern.
Figure 4.
Figure 4.
Involvement of tyrosine kinases in IL-1β facilitation of the NMDA response. A, Hippocampal neurons were exposed simultaneously to 0.05 ng/ml IL-1β and 10 μm NMDA (dotted column) or pretreated for 6 min with 0.05 ng/ml IL-1β and then stimulated with 10 μm NMDA (black column). Values are means ± SE of five independent samples and represent the average peak Ca2+ response. **p < 0.01 versus control; ANOVA followed by Tukey's test. B, Average peak Ca2+ increase as percentage of the NMDA response in control neurons ± lavendustin A or PP2 and in IL-1β-pretreated neurons ± lavendustin A or PP2. Hippocampal neurons were pretreated with 500 nm lavendustin A or 1 μm PP2 for 30 min and then exposed to NMDA alone or 0.05 ng/ml IL-1 β for 6 min and subsequently stimulated with 10 μm NMDA. Values are means ± SE of five independent samples. **p < 0.01 versus IL-1 plus NMDA; ANOVA followed by Tukey's test.
Figure 5.
Figure 5.
IL-1β-induced phosphorylation of NR2A/B subunits through the Src family of tyrosine kinases. A, Metabolic labeling and immunoprecipitation of NR2A/B subunits. Hippocampal neurons were incubated for 30 min in HBSS plus 500 nm lavendustin A (LAV) or 1 μm PP2 and then exposed to 0.05 ng/ml IL-1β for 6 min. Controls (C) were hippocampal neurons incubated in HBSS for 36 min. B, Histogram shows the 32P incorporation in NR2A/B subunits in the various experimental conditions, expressed as percentage of control. Values were normalized as reported in Materials and Methods. Lavendustin and PP2 alone were not different from the control. Values are mean ± SE (n = 6). **p < 0.01 IL-1 versus control; §§p < 0.01 IL-1 + LAV and IL-1 + PP2 versus IL-1 by ANOVA followed by Tukey's test. C, Representative autoradiography showing the presence of a phosphorylated protein band of apparent molecular weight 65 kDa in anti-NR2A/B immunoprecipitates (arrowhead). Molecular weight standards are reported to the left. D, Histograms shows 32P incorporation in a 65 kDa phospho-band in the various experimental conditions, expressed as percentage of control. Values were normalized as reported in Materials and Methods. Lavendustin and PP2 alone were not different from the control. Values are mean ± SE (n = 6). **p < 0.01 IL-1 versus control; §§p < 0.01 IL-1 + LAV and IL-1 + PP2 versus IL-1 by ANOVA followed by Tukey's test.
Figure 6.
Figure 6.
IL-1β-induced phosphorylation of Src-Tyr-416 and NR2B-Tyr-1472. A, Proteins from hippocampal cell lysates were immunoprecipitated (IP) with a polyclonal antibody raised against NR2A/B. Western blot was done in the immunoprecipitated material using the NR2A/B antibody (top) or the phospho-specific p416Src antibody (bottom). Histograms in B show the quantification of the Tyr416-phosphorylated Src coimmunoprecipitated with the NR2A/B subunits. Data are normalized for NR2A/B immunoreactivity. Values are mean ± SE of two independent experiments (**p < 0.01 IL-1 vs control; §p < 0.05 IL-1 + LAV and IL-1 + PP2 vs IL-1; ANOVA followed by Tukey's test). C, Representative Western blot depicting increased phosphorylation of NR2B-Tyr-1472 after exposure to IL-1 β (bottom). D, Quantification of Tyr-1472 phosphorylation in the various experimental conditions. Data are normalized for NR2A/B immunoreactivity (top) in the respective samples, which did not differ among treatments. Values are mean ± SE (n = 6) obtained from two experiments, each including three independent samples (**p < 0.01 IL-1 vs control; §p < 0.05 IL-1 + LAV and IL-1 + PP2 vs IL-1; ANOVA followed by Tukey's test).
Figure 7.
Figure 7.
IL-1RI surface expression after lavendustin and PP2 exposure. Hippocampal neurons were preincubated for 30 min with HBSS plus 500 nm lavendustin A or 1 μm PP2 or to HBSS for 30 min (control). IL-1RI surface expression was measured by membrane-impermeant biotinylation techniques. A, Representative Western blot showing IL-1RI cell surface expression in the various experimental conditions. Histograms in B show the quantification of IL-1RI concentrations on cell surface in the various experimental conditions. Data are normalized for IL-1RI concentrations in the total cell lysates. Values are mean ± SE of three independent samples.
Figure 8.
Figure 8.
Lack of effect of PP2 on IL-1β-induced IL-6 mRNA expression. Hippocampal neurons were preincubated for 30 min with HBSS ± 1 μm PP2 and then exposed to 0.05 ng/ml IL-1β for 6 min. Control neurons were exposed to HBSS for the duration of the experiment. IL-6 mRNA expression was measured 3 hr later by RT-PCR.
Figure 9.
Figure 9.
IL-1β effect on NMDA-induced neurotoxicity. Hippocampal neurons were preincubated for 30 min with HBSS ± 500 nm lavendustin A or 1 μm PP2 and then exposed to NMDA only or to 0.05 ng/ml IL-1β for 6 min and subsequently to 10 μm NMDA for 3 hr. Control neurons were exposed to HBSS for the duration of the experiment. At the end of this period, neurons were returned to conditioned culture medium for 24 hr. MTT test was performed to assay cell viability. The enhancing effect of IL-1β on NMDA-induced neuronal cell death was prevented by both lavendustin A and PP2. Both lavendustin A and PP2 did not affect cell viability per se (% of control; controls: 100 ± 7.8; lavendustin A: 104 + 9.2; PP2: 101 ± 13.5). Values are mean ± SE of six independent experiments: *p < 0.05 IL-1 versus control; §p < 0.05 IL-1 plus LAV or plus PP2 versus IL-1; ANOVA followed by Tukey's test.

References

    1. Allan SM, Rothwell NJ ( 2001) Cytokines and acute neurodegeneration. Nat Rev Neurosci 2: 734-744. - PubMed
    1. Allan SM, Parker LC, Collins B, Davies R, Luheshi GN, Rothwell NJ ( 2000) Cortical cell death induced by IL-1 is mediated via actions in the hypothalamus of the rat. Proc Natl Acad Sci USA 97: 5580-5585. - PMC - PubMed
    1. Chatterton JE, Awobuluyi M, Premkumar LS, Takahashi H, Talantova M, Shin Y, Cul J, Tu S, Sevarino KA, Nakanishi N, Tong G, Lipton SA, Zhang D ( 2002) Excitatory glycine receptors containing the NR3 family of NMDA receptor subunits. Nature 415: 793-798. - PubMed
    1. Coogan A, O'Connor JJ ( 1997) Inhibition of NMDA receptor-mediated synaptic transmission in the rat dentate gyrus in vitro by IL-1 beta. NeuroReport 8: 2107-2110. - PubMed
    1. Cooper JA, MacAuley A ( 1998) Potential positive and negative autoregulation of p60-src by intermolecular autophosphorylation. Proc Natl Acad Sci USA 85: 4232-4236. - PMC - PubMed

Publication types

MeSH terms