. 2003 Sep 24;23(25):8759-70.
doi: 10.1523/JNEUROSCI.23-25-08759.2003.

Development of columnar topography in the excitatory layer 4 to layer 2/3 projection in rat barrel cortex

Affiliations

Development of columnar topography in the excitatory layer 4 to layer 2/3 projection in rat barrel cortex

Kevin J Bender et al. J Neurosci. .

Abstract

The excitatory feedforward projection from layer (L) 4 to L2/3 in rat primary somatosensory (S1) cortex exhibits precise, columnar topography that is critical for columnar processing of whisker inputs. Here, we characterize the development of axonal topography in this projection using single-cell reconstructions in S1 slices. In the mature projection [postnatal day (P) 14-26], axons of L4 cells extending into L2/3 were confined almost entirely to the home barrel column, consistent with previous results. At younger ages (P8-11), however, axonal topography was significantly less columnar, with a large proportion of branches innervating neighboring barrel columns representing adjacent whisker rows. Mature topography developed from this initial state by targeted axonal growth within the home column and by growth of barrel columns themselves. Raising rats with all or a subset of whiskers plucked from P8-9, manipulations that induce reorganization of functional whisker maps and synaptic depression at L4 to L2/3 synapses, did not alter normal anatomical development of L4 to L2/3 axons. Thus, development of this projection does not require normal sensory experience after P8, and deprivation-induced reorganization of whisker maps at this age is unlikely to involve physical remodeling of L4 to L2/3 axons.


Figures
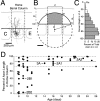
Figure 3.
Figure 3.
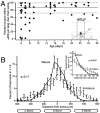
Development of columnar topography measured relative to the home barrel column. A, Definition of home barrel column. Dashed lines represent midpoints of septa. Horizontal line represents L3/4 border. A P14 star pyramid in across-row slice is shown. B, Schematic of nondirected axon growth model. Variables (x, d, c) are measured for each experimental group (see Materials and Methods for definitions). ATot is enclosed by solid black lines; AHome is gray. Assuming nondirected growth if uniform density is around the soma, the fraction of axon in the home column in L1-3 is AHome/ATot. Vertical scale indicates percentage depth in L1-3 from pia. C, Sublaminar distribution of axon length in L1-3 for mature cells (P14-26). Of the total axon length (gray), 95% occurs in the deepest 70% of L1-3. Bars represent SEM. D, Percentage of axon length in L1-3 contained within home barrel column as a function of age, for all cells. Solid and dashed lines indicate mean ± SD for mature cells (P14-26). Labels indicate cells shown in Figures 2 and 3A.
Figure 1.
Figure 1.
Labeling and reconstruction of single spiny stellate cell in L4 of S1. A, Photomontage from a single 100-μm-thick section showing a biocytin-labeled L4 spiny stellate neuron in an across-row slice (P21). Insets show dendrite with spines (arrowheads) and axon with boutons (arrows). B, Osmium-intensified barrels in an adjacent section from the same slice. C, Full reconstruction of the neuron in A and B. Soma and dendrite are in black, axon is in dark gray, and barrels and pia are in light gray. Numbers indicate cortical layers.
Figure 2.
Figure 2.
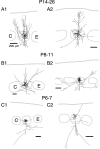
Representative examples of L4 excitatory cells in across-row slices at different ages. Lateral is to left. Scale bar, 200 μm. L5 and 6 boundaries are not shown. Letters in barrels indicate barrel rows.
Figure 4.
Figure 4.
Development of columnar topography measured relative to the ±220 μm column. A, Percentage of axon length in L1-3 contained within ±220 μm tangential distance from soma as a function of age. Solid and dashed lines represent mean ± SD for mature cells. B, Distribution of axon length in L1-3 as a function of tangential distance from soma, for immature (P8-11) and mature (P14-26) cell groups. Bars represent SEM. Ellipses show approximate barrel boundaries. Inset, Average falloff of the data determined by summing both flanks of the distributions in B.
Figure 5.
Figure 5.
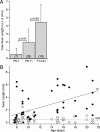
Topographic refinement in the across-row plane occurs through targeted axon growth. A, Total axon length in L1-3 as a function of age. Bars are SD. Parentheses indicate number of cells. B, Axon length within (filled circles) and outside (open circles) the ± 220 μm column, as a function of age. Least-squares regression lines show a significant increase in axon length within the ± 220 μm column with age (p = 0.0001; R2 = 0.27), but no significant regression outside the ± 220 μm column.
Figure 6.
Figure 6.
Development of axons in the within-row plane. A, Distribution of axon length as a function of tangential distance from soma for mature neurons in within-row and across-row planes of section. B, Distribution of axon as a function of tangential distance from soma for immature (P8-11) and mature (P17-21) cells in the within-row plane. Bars represent SEM. Ellipses show approximate barrel boundaries. C, Total axon length in L2/3 as a function of age. Bars represent SD. Parentheses indicate number of cells. D, Axon length within (filled circles) and outside (open circles) the ±220 μm column as a function of age. Regression lines indicate that axon length increased significantly with age both within (p < 0.02; R2 = 0.18) and outside (p < 0.02; R2 = 0.18) the ±220 μm column.
Figure 7.
Figure 7.
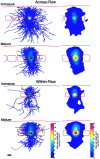
Summary of axonal topography from all reconstructed cells. Left, Overlay of all reconstructed axons relative to barrel column. Individual axons were scaled to normalize barrel width and pia to L4/5 distance to mean values and aligned by barrel boundaries. Dots indicate location of somata in L4. Right, Same data smoothed using a two-dimensional, 50 μm SD Gaussian. Barrels and pia are in red. Barrels and septa size are drawn to accurately reflect mean size for each developmental age and plane of section. Scale bar, 200 μm for all panels.
Figure 8.
Figure 8.
Whisker experience does not alter axonal morphology. A, Tangential distribution of axon length for control rats and rats deprived of all whiskers unilaterally. B, Tangential distribution of axon length for control rats and rats deprived of the D-row of whiskers. Bars represent SEM. Ellipses show approximate barrel boundaries. C, Total axon length in L2/3 for all conditions. D, Percentage of axon in home column for all conditions. Diamonds represent P14-17 rats. Circles indicate P18-22 rats. Triangles indicate P23-26 rats. Horizontal bars represent means.
Figure 9.
Figure 9.
Schematic model of L4 to L2/3 axonal development. Arrow thickness is proportional to mean total axon length in L2/3 of the home column (center arrow) and each of two neighboring columns through development. Numbers indicate percentage of axon in the home barrel column for that age (dashed lines). Barrels and septa are drawn to scale across all conditions, as in Figure 7.

References

    1. Agmon A, Yang LT, O'Dowd DK, Jones EG ( 1993) Organized growth of thalamocortical axons from the deep tier of terminations into layer IV of developing mouse barrel cortex. J Neurosci 13: 5365-5382. - PMC - PubMed
    1. Agmon A, Yang LT, Jones EG, O'Dowd DK ( 1995) Topological precision in the thalamic projection to neonatal mouse barrel cortex. J Neurosci 15: 549-561. - PMC - PubMed
    1. Allen CB, Celikel T, Feldman DE ( 2003) Long-term depression induced by sensory deprivation during cortical map plasticity in vivo. Nat Neurosci 6: 291-299. - PubMed
    1. Antonini A, Stryker MP ( 1993a) Development of individual geniculocortical arbors in cat striate cortex and effects of binocular impulse blockade. J Neurosci 13: 3549-3573. - PMC - PubMed
    1. Antonini A, Stryker MP ( 1993b) Rapid remodeling of axonal arbors in the visual cortex. Science 260: 1819-1821. - PubMed

Publication types

MeSH terms

LinkOut - more resources