. 2003 Oct;15(10):2448-63.
doi: 10.1105/tpc.015016. Epub 2003 Sep 24.

Lesions in phycoerythrin chromophore biosynthesis in Fremyella diplosiphon reveal coordinated light regulation of apoprotein and pigment biosynthetic enzyme gene expression

Affiliations

Lesions in phycoerythrin chromophore biosynthesis in Fremyella diplosiphon reveal coordinated light regulation of apoprotein and pigment biosynthetic enzyme gene expression

Richard M Alvey et al. Plant Cell. 2003 Oct.

Abstract

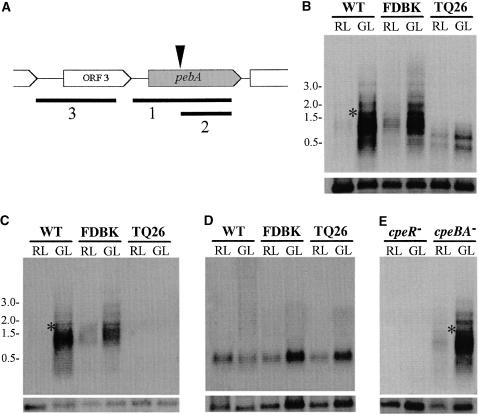
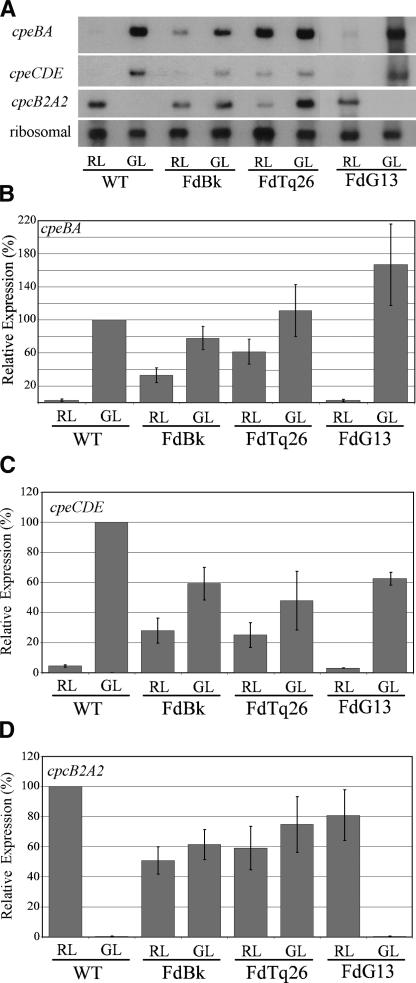
We have characterized the regulation of the expression of the pebAB operon, which encodes the enzymes required for phycoerythrobilin synthesis in the filamentous cyanobacterium Fremyella diplosiphon. The expression of the pebAB operon was found to be regulated during complementary chromatic adaptation, the system that controls the light responsiveness of genes that encode several light-harvesting proteins in F. diplosiphon. Our analyses of pebA mutants demonstrated that although the levels of phycoerythrin and its associated linker proteins decreased in the absence of phycoerythrobilin, there was no significant modulation of the expression of pebAB and the genes that encode phycoerythrin. Instead, regulation of the expression of these genes is coordinated at the level of RNA accumulation by the recently discovered activator CpeR.


Figures

Figure 1.
Figure 1.
Biosynthesis Pathways Leading to the Synthesis of PEB, PCB, and PΦB from BV. Information regarding the bilin biosynthetic enzymes listed is provided in the text. Dashed arrow indicates step of the pathway that has been shown to exist in red algae but that has not yet been identified in cyanobacteria.
Figure 2.
Figure 2.
Whole-Cell Absorption Spectra of F. diplosiphon Wild-Type and Mutant Lines Grown in GL or RL. (A) Wild type. (B) FdBk mutant. (C) FdTq26 mutant. (D) FdTq26 mutant transformed with pDK4 (containing rcaE). (E) FdG13 mutant. Solid lines indicate cells grown in GL, and dotted lines indicate cells grown in RL. The scan shown for each line is representative of at least three independent replications. Maximum PE and PC absorption peaks are indicated. Chlorophyll a absorption peaks are at 430 and 680 nm.
Figure 3.
Figure 3.
Whole-Cell Absorption Spectra of FdTq26 and FdG13 Cells Transformed with Different Plasmids and Grown in GL or RL. (A) and (D) FdTq26 (A) and FdG13 (D) transformed with pPLER2. (B) and (E) FdTq26 (B) and FdG13 (E) transformed with pRA-4. (C) and (F) FdTq26 (C) and FdG13 (F) transformed with pRA-45. Solid lines indicate cells grown in GL, and dotted lines indicate cells grown in RL. The scan shown for each line is representative of at least three independent replications. Maximum PE and PC absorption peaks are indicated. Chlorophyll a absorption peaks are at 430 and 680 nm.
Figure 4.
Figure 4.
The F. diplosiphon Genomic DNA Fragment within pPLER2 Contains Five Significant ORFs. (A) Relative positions and orientations of the five ORFs. The total number of amino acids encoded by each ORF and the number of nucleotides between each ORF, or between the ORF and the end of the DNA fragment, are indicated. The translation start site used was at the first Met for each ORF except ORF5, for which the first Ile was used. The locations of the DNA insertions are indicated for FdG13 (open arrowhead) and FdTq26 (closed arrowhead). (B) Regions of pPLER2 used to construct the subclones pRA-4 (top) and pRA-45 (bottom). (C) Amino acid sequence of ORF4 and alignment with PebA sequences from two other cyanobacterial species. The locations of the lesions within the PebA sequences of FdG13 and FdTq26 are noted by the open and closed circles, respectively. (D) Amino acid sequence of ORF5 and alignment with PebB sequences from two other cyanobacterial species. In (C) and (D), dark gray blocks denote identical amino acid residues, and light gray blocks denote similar amino acid residues as follows: M = I = L = V, W = Y = F, N = Q, D = E, and K = R. N. punc., N. punctiforme; Syn 8020, Synechococcus sp WH 8020.
Figure 5.
Figure 5.
HPLC-MS Analyses of Free Bilins Present within F. diplosiphon. Extracted ion chromatograms (top) and mass spectra (bottom) of bilin standards (A), the FdG13 mutant (B), the FdG13 mutant transformed with pRA-4 (C), and the FdG13 mutant transformed with pRA-45 (D). In the top panels, the x axis indicates retention time and the y axis indicates ion current sums (in arbitrary units) from mass/charge ratios of 583.0 to 584.0, 585.0 to 586.0, and 587.0 to 588.0; in the bottom panels, integrated mass spectra are provided. Retention times for the labeled peaks are as follows: for FdG13, + = 11.5 min, = 13.8 min, and = 16.5 min; for FdG13/pRA-4, § = 8.2 min and # = 9.1 min; for FdG13/pRA-45, * = 8.3 min. Data shown are representative of at least three independent experiments (including transformations, as applicable) for each sample.
Figure 6.
Figure 6.
RNA Gel Blot Analyses Demonstrate That the Expression of pebAB Is Light Regulated. (A) Map showing the coverage (thick lines) of each of the three probes (1, 2, and 3) used in (B) to (E). The approximate location of the DNA insertion within pebA in FdTq26 is denoted by the black arrowhead. (B) Autoradiogram of a blot after hybridization of probe 1 to RNA isolated from RL- and GL-grown wild-type (WT), FdBk mutant (FDBK), and FdTq26 (TQ26) cells. (C) Autoradiogram of a blot after hybridization of probe 2 to RNA isolated as in (B). (D) Autoradiogram of a blot after hybridization of probe 3 to RNA isolated as in (B). (E) Autoradiogram of a blot after hybridization of probe 1 to RNA isolated from RL- and GL-grown FdTq1 (cpeR) and FdTq31 (cpeA) cells. The autoradiograms shown for each sample are representative of three independent experiments. Approximate sizes (in kb) are provided at left, and an autoradiogram of each blot after hybridization to a ribosomal probe is provided below each gel. The ∼1.6-kb RNA species is marked with an asterisk.
Figure 7.
Figure 7.
Promoters of the pebAB and cpeBA Operons Contain Regions of Conserved Sequence. (A) Sequence comparison of cpeBA promoter elements from three cyanobacterial species. (B) Sequence comparison of the pebAB and cpeBA promoter elements from F. diplosiphon. (C) Sequence comparison of the pebAB promoters from two cyanobacterial species. Shaded positions denote shared sequence identity, and boxed sequences encompass the pentanucleotide direct repeat. F. dip., F. diplosiphon; Nostoc, N. punctiforme; Pseud., Pseudanabaena sp PCC 7409. Fractions in parentheses indicate comparisons between species of the numbers of identical nucleotides divided by the total number of nucleotides for that subregion (indicated at bottom): F, F. diplosiphon; N, N. punctiforme; P. Pseudanabeana. Distances from the Pseudanabaena sp PCC 7409 cpeBA transcription start site (Dubbs and Bryant, 1991) are shown above the sequences, and binding sites for the DNA binding proteins RcaA (solid line) (Sobczyk et al., 1993) and PepB (dashed line) (Schmidt-Goff and Federspiel, 1993) are shown below the sequences.
Figure 8.
Figure 8.
RNA Gel Blot Analyses of cpeBA, cpeCDE, and cpcB2A2 Expression in RL- and GL-Grown Wild-Type, FdBk Mutant, FdTq26, and FdG13 Cells. (A) Representative autoradiograms of the data presented in (B) through (D) showing hybridization to the probes listed at left. WT, wild type. (B) and (C) Mean values from at least three independent experiments of cpeBA (B) or cpeCDE (C) RNA levels in these four lines expressed as a percentage of the wild-type GL value, which was set to 100%. (D) Mean values from at least three independent experiments of cpcB2A2 RNA levels in these four lines expressed as a percentage of the wild-type RL value, which was set to 100%. In (B) to (D), standard errors are shown, and selected P values are provided in the text. All measurements were normalized using relative ribosomal hybridization values before calculation of the means.
Figure 9.
Figure 9.
SDS-PAGE of Total Protein Extracted from Wild-Type, FdBk Mutant, and FdTq26 Cells Grown in RL or GL. Five micrograms of purified PBS proteins extracted from wild-type cells grown in RL or GL was used as a control. Components of the PBS are labeled as identified previously (Bryant, 1981; Federspiel and Grossman, 1990). WT, wild type.

Similar articles

Cited by

References

    1. Anderson, L.K., and Grossman, A.R. (1990). Structure and light-regulated expression of phycoerythrin genes in wild type and phycobilisome assembly mutants of Synechocystis sp. strain PCC 6701. J. Bacteriol. 172, 1297–1305. - PMC - PubMed
    1. Anderson, L.K., and Toole, C.M. (1998). A model for early events in the assembly pathway of cyanobacterial phycobilisomes. Mol. Microbiol. 30, 467–474. - PubMed
    1. Arciero, D.M., Bryant, D.A., and Glazer, A.N. (1988). In vitro attachment of bilins to apophycocyanin. I. Specific covalent adduct formation at cysteinyl residues involved in phycocyanobilin binding in C-phycocyanin. J. Biol. Chem. 263, 18343–18349. - PubMed
    1. Beale, S.I., and Cornejo, J. (1991. a). Biosynthesis of phycobilisomes: 3(Z)-Phycoerythrobilin and 3(Z)-phycocyanobilin are intermediates in the formation of 3(E)-phycocyanobilin from biliverdin IXα. J. Biol. Chem. 266, 22333–22340. - PubMed
    1. Beale, S.I., and Cornejo, J. (1991. b). Biosynthesis of phycobilisomes: 15,16-Dihydrobiliverdin IXα is a partially reduced intermediate in the formation of phycobilins from biliverdin IXα. J. Biol. Chem. 266, 22341–22345. - PubMed

Publication types

MeSH terms

LinkOut - more resources