. 2003 Oct;15(10):2399-407.
doi: 10.1105/tpc.014498. Epub 2003 Sep 24.

Functional characterization of phytochrome interacting factor 3 in phytochrome-mediated light signal transduction

Affiliations

Functional characterization of phytochrome interacting factor 3 in phytochrome-mediated light signal transduction

Jonghyun Kim et al. Plant Cell. 2003 Oct.

Abstract

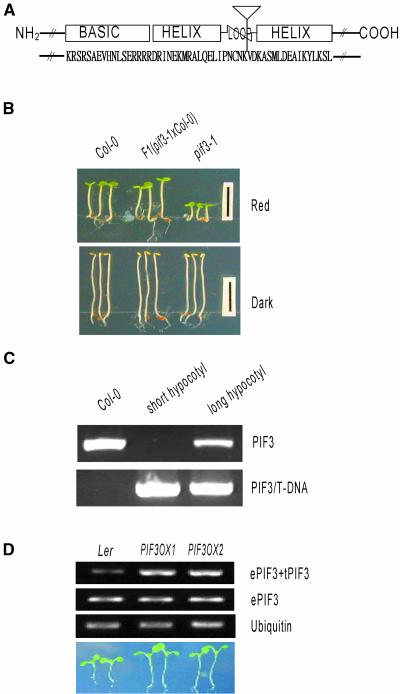
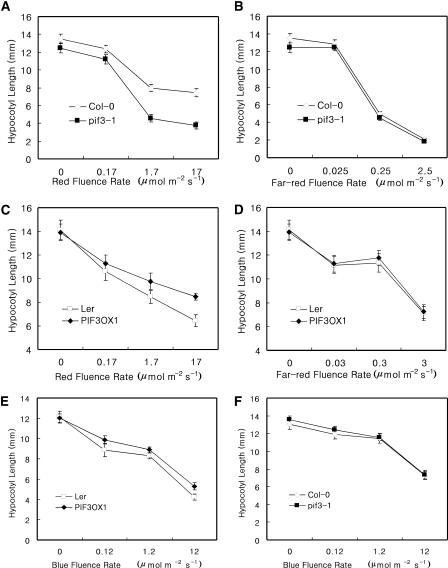
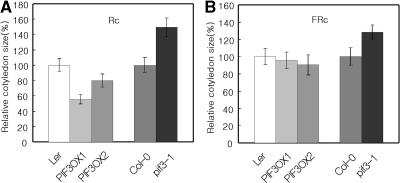
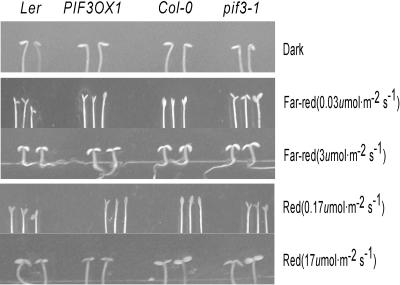
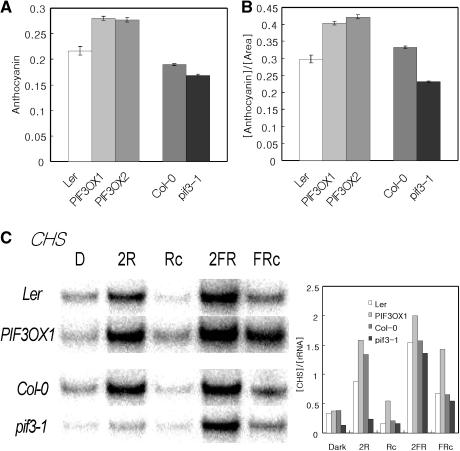
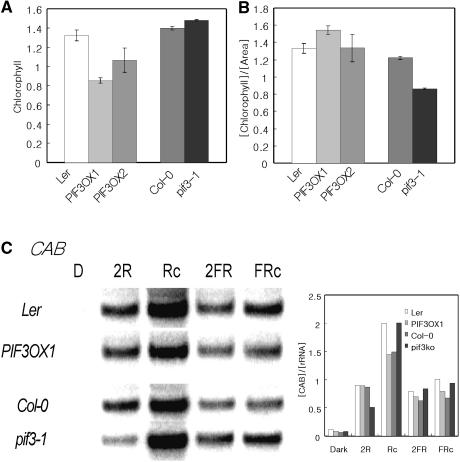
Phytochromes regulate various light responses through their interactions with different signaling proteins, such as phytochrome interacting factor 3 (PIF3). However, the physiological functions of PIF3 in light signaling are not yet fully understood. To increase our understanding of these roles, we characterized a T-DNA insertional pif3 mutant and transgenic plants overexpressing the full-length PIF3. Transgenic overexpressing lines displayed longer hypocotyls and smaller cotyledons under red light and reduced cotyledon opening under both red and far-red light, whereas the pif3 mutant showed the opposite phenotypes. The accumulation of anthocyanin and chlorophyll further indicated complicated features of PIF3 function. The accumulation of anthocyanin was increased and the content of chlorophyll was decreased in the overexpression lines. Our data indicate that PIF3 plays complex roles depending on the type of light response and the light conditions.


Figures

Figure 1.
Figure 1.
Phenotypes of the pif3-1 Mutant and PIF3OX. (A) Diagram of the PIF3 protein and the T-DNA insertion site. The inverted triangle indicates the T-DNA insertion site, and uppercase letters indicate the amino acid sequence corresponding to the bHLH region in PIF3. (B) Hypocotyl phenotypes of wild type Columbia (Col-0), pif3-1, and heterozygous PIF3 [F1(pif3-1×Col-0] plants. (C) Cosegregation analysis. Col-0 indicates genomic DNA of the wild-type plant, short hypocotyl indicates a genomic pool of 40 seedlings that had short hypocotyls and larger cotyledons, and long hypocotyl indicates a genomic pool of 126 seedlings that had long hypocotyls and smaller cotyledons. PIF3 indicates the PCR product of full-length PIF3, and PIF3/T-DNA indicates the PCR product of the PIF3–T-DNA hybrid fragment. (D) Overexpression of PIF3 in transgenic plants. ePIF3 indicates endogenous PIF3, and tPIF3 indicates transgenic PIF3 in the PIF3-overexpressing lines (PIF3OX1 and PIF3OX2). The photograph at bottom shows the hypocotyl lengths of wild-type Landsberg erecta (Ler) and PIF3OX plants grown under white light.
Figure 2.
Figure 2.
Red and Far-Red Fluence Rate Response Curves for Hypocotyl Lengths. (A) Red light fluence rate response curve of pif3-1 plants. (B) Far-red light fluence rate response curve of pif3-1 plants. (C) Red light fluence rate response curve of PIF3OX plants. (D) Far-red light fluence rate response curve of PIF3OX plants. (E) Blue light fluence rate response curve of PIF3OX plants. (F) Blue light fluence rate response curve of pif3-1 plants.
Figure 3.
Figure 3.
PHY-Induced Cotyledon Expansion in Both pif3-1 and PIF3OX Plants. (A) Red light–induced cotyledon expansion. (B) Far-red light–induced cotyledon expansion. FRc, samples grown in far-red light; Rc, samples grown in red light.
Figure 4.
Figure 4.
PHY-Induced Cotyledon Opening in pif3-1 and PIF3OX Plants. Phenotypic differences can be seen at the lower fluence rates of red and far-red light.
Figure 5.
Figure 5.
Accumulation of Anthocyanin and Expression of CHS in pif3-1 and PIF3OX Plants. (A) Accumulation of anthocyanin in pif3-1 and PIF3OX plants. (B) Anthocyanin content normalized by cotyledon size. (C) RNA gel blot analysis of CHS. Samples were grown for 4 days. The graph indicates the levels of CHS normalized to that of 18s rRNA. D, samples grown in the dark; 2R, samples transferred from dark to red light for 2 h; Rc, samples grown in red light; 2FR, samples transferred from dark to far-red light for 2 h; FRc, samples grown in far-red light.
Figure 6.
Figure 6.
Accumulation of Chlorophyll and the Expression Pattern of CAB in pif3-1 and PIF3OX Plants. (A) Accumulation of chlorophyll in pif3-1 and PIF3OX plants. (B) Chlorophyll content normalized by cotyledon size. (C) RNA gel blot analysis of CAB. Samples were grown for 4 days. The graph indicates levels of CAB normalized to that of 18s rRNA. D, samples grown in the dark; 2R, samples transferred from dark to red light for 2 h; Rc, samples grown in red light; 2FR, samples transferred from dark to far-red light for 2 h; FRc, samples grown in far-red light.

References

    1. Borevitz, J.O., Maloof, J.N., Lutes, J., Dabi, T., Redfern, J.L., Trainer, G.T., Werner, J.D., Asami, T., Berry, C.C., Weigel, D., and Chory, J. (2002). Quantitative trait loci controlling light and hormone response in two accessions of Arabidopsis thaliana. Genetics 160, 683–696. - PMC - PubMed
    1. Brownlie, P., Ceska, T., Lamers, M., Romier, C., Stier, G., Teo, H., and Suck, D. (1997). The crystal structure of an intact human Max-DNA complex: New insights into mechanisms of transcriptional control. Structure 5, 509–520. - PubMed
    1. Choe, S., Fujioka, S., Noguchi, T., Takatsuto, S., Yoshida, S., and Feldmann, K.A. (2001). Overexpression of DWARF4 in the brassinosteroid biosynthetic pathway results in increased vegetative growth and seed yield in Arabidopsis. Plant J. 26, 573–582. - PubMed
    1. Clack, T., Mathews, S., and Sharrock, R.A. (1994). The phytochrome apoprotein family in Arabidopsis is encoded by five genes: The sequences and expression of PHYD and PHYE. Plant Mol. Biol. 25, 413–427. - PubMed
    1. Ellenberger, T., Fass, D., Arnaud, M., and Harrison, S.C. (1994). Crystal structure of transcription factor E47: E-box recognition by a basic region helix-loop-helix dimer. Genes Dev. 8, 970–980. - PubMed

Publication types

Associated data