. 2003 Oct;73(4):898-925.
doi: 10.1086/378816. Epub 2003 Sep 23.

Identification of four highly conserved genes between breakpoint hotspots BP1 and BP2 of the Prader-Willi/Angelman syndromes deletion region that have undergone evolutionary transposition mediated by flanking duplicons

Affiliations

Identification of four highly conserved genes between breakpoint hotspots BP1 and BP2 of the Prader-Willi/Angelman syndromes deletion region that have undergone evolutionary transposition mediated by flanking duplicons

J-H Chai et al. Am J Hum Genet. 2003 Oct.

Abstract

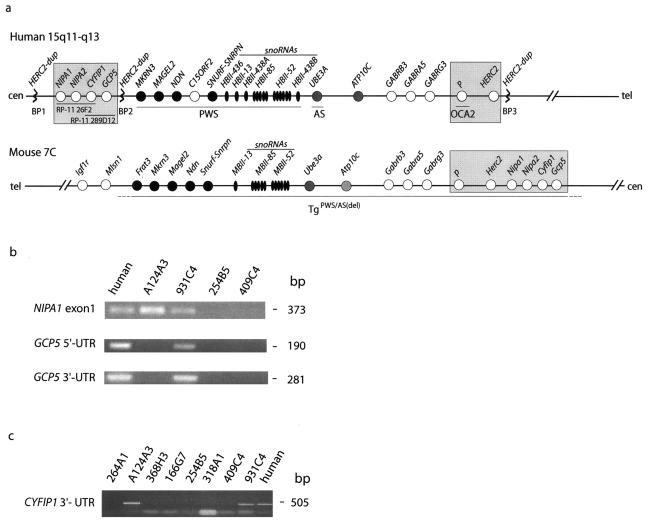
Prader-Willi and Angelman syndromes (PWS and AS) typically result from an approximately 4-Mb deletion of human chromosome 15q11-q13, with clustered breakpoints (BP) at either of two proximal sites (BP1 and BP2) and one distal site (BP3). HERC2 and other duplicons map to these BP regions, with the 2-Mb PWS/AS imprinted domain just distal of BP2. Previously, the presence of genes and their imprinted status have not been examined between BP1 and BP2. Here, we identify two known (CYFIP1 and GCP5) and two novel (NIPA1 and NIPA2) genes in this region in human and their orthologs in mouse chromosome 7C. These genes are expressed from a broad range of tissues and are nonimprinted, as they are expressed in cells derived from normal individuals, patients with PWS or AS, and the corresponding mouse models. However, replication-timing studies in the mouse reveal that they are located in a genomic domain showing asynchronous replication, a feature typically ascribed to monoallelically expressed loci. The novel genes NIPA1 and NIPA2 each encode putative polypeptides with nine transmembrane domains, suggesting function as receptors or as transporters. Phylogenetic analyses show that NIPA1 and NIPA2 are highly conserved in vertebrate species, with ancestral members in invertebrates and plants. Intriguingly, evolutionary studies show conservation of the four-gene cassette between BP1 and BP2 in human, including NIPA1/2, CYFIP1, and GCP5, and proximity to the Herc2 gene in both mouse and Fugu. These observations support a model in which duplications of the HERC2 gene at BP3 in primates first flanked the four-gene cassette, with subsequent transposition of these four unique genes by a HERC2 duplicon-mediated process to form the BP1-BP2 region. Duplicons therefore appear to mediate genomic fluidity in both disease and evolutionary processes.


Figures

Figure  1
Figure 1
Genetic and physical maps. a, Schematic maps of human chromosome 15q11-q13 and the homologous mouse chromosome 7C region. PWS/AS deletion BP hotspots 1–3 associated with HERC2 duplicons (dup) are shown, and the regions studied in the present work are boxed and shaded. Two BAC clones spanning the four novel BP1–BP2 genes are indicated. Black and dark gray circles represent paternally and maternally expressed imprinted genes, respectively, and white circles are biallelic, nonimprinted genes (the mouse Atp10c gene is likely, but not proven, to be maternally expressed [light gray circle]). Genes or regions associated with PWS, AS, oculocutaneous albinism type II (OCA2), and a transgene insertion-deletion mouse model of PWS/AS [TgPWS/AS(del)] are indicated. b, PCR mapping of NIPA1 and GCP5 STS markers within YACs spanning the BP1–BP2 region. c, PCR detection of a CYFIP1 STS marker in BP1–BP2 YACs. d, Orientation of BP1–BP2 genes, with detailed map of YACs and STS markers spanning BP1–BP2. Markers from this study are shown by large black circles, and data for the HERC2-dup CpG island probe (black squares, HindIII fragment sizes in kb also shown) and 254RL2 probe (gray squares) are from Amos-Landgraf et al. (1999). The left (L) and right (R) YAC ends (Ye), and deleted fragment (?) are also shown. e, Schematic of class I and II PWS and AS deletions, with detection by FISH using unique BAC clones spanning CYFIP1. f, Fine mapping and BAC contig of six nonimprinted genes in mouse 7C. Each gene is shown proportionally by the length of black arrows, with direction of transcription from 5′ to 3′. The map was determined by STS analysis derived from exons (e) and BAC ends in a series of BACs and mouse 10-kb clones (thin black bars under genes). Black and white squares represent STSs confirmed by PCR assay or identified by database DNA sequence analysis without further PCR assay, respectively.
Figure  2
Figure 2
FISH mapping of CYFIP1 in human and mouse, as well as DNA replication-timing asynchrony at the mouse Nipa1-Nipa2-Cyfip1 locus. a, BAC 3242E18 spanning CYFIP1 (fig. 1e) is unique and maps to human chromosome 15q11.2 (arrows). b, BAC 252P22 (fig. 1f) maps to mouse chromosome 7C (green signal, yellow arrow) in metaphase chromosomes from TgPWS(del) mice. A control probe identifies the chromosome 7 centromere (red signal, white arrow) but also hybridizes to the telomere of chromosome 5 (white arrowhead). c, Probes from imprinted (BACs RP-23 371M8 and 266F22 for Snurf-Snrpn and Mkrn3, respectively) and nonimprinted (BACs 452K16 and 252P22 for Nipa1-Nipa2-Cyfip1; see fig. 1f and fig. 5) loci exhibit asynchronous replication (a high singlet/doublet [1/2] proportion of hybridization foci in S-phase cells, comparable to prior studies [Kitsberg et al. 1993; Greally et al. 1998; Simon et al. 1999]).
Figure  3
Figure 3
Vertebrate Nipa1 and Nipa2 gene structures. a, Schematic genomic structure of NIPA1 in human, mouse and Fugu. Coding regions (shaded rectangles) and untranslated (5′ UTR and 3′ UTR) regions (open rectangles) are shown. The horizontal black bars are CpG islands, the arrows below the exons (e) are primers used for RT-PCR, and the vertical dotted lines are functional polyA signals (predicted in Fugu). Alternative polyadenylation generates two different 3′ ends for human and mouse Nipa1 (with distance between the polyA signals shown). b, Highly conserved 3′ ends of the mammalian NIPA1 7.5-kb mRNA sequences from five eutherian species, aligned by CLUSTAL W. Black nucleotides with gray background agree with the consensus, and polyA signals are shown as white letters on black background. GenBank accession numbers for the NIPA1 3′ ESTs are as follows: human, BF439642; pig, BI339387; cow, BE685351; mouse, BE946294; and rat, AW533027. c, Genomic structure of orthologous human, mouse, and Fugu NIPA2 genes, as well as conserved intron placement in ancestral genes from Drosophila and Anopheles. Symbols as for panel a. The shaded box in exon 1 represents uORF1, but putative 5′ noncoding exons in Fugu (dotted line) have not been identified. d, Conserved ORFs in the 5′ UTR (exons 1–3) of the vertebrate NIPA2 transcripts. White letters on black background represent sequences conserved in all species shown, black letters with gray background have one mismatch, and the initiation codons of NIPA2 and uORF1 have bold white letters on black background. Also shown are exon (ex) positions for the mouse (mu) gene, and the stop (TGA or TAA) codons for the uORF1. GenBank accession numbers for the NIPA2 5′ ESTs are as for figure 4b,, and the GenBank accession number for dog is BM538411. Alignments were generated with CLUSTAL W. e, Amino acid sequence of the putative exon 1 uORF1 from human, mouse, cow, dog, chicken (uORF2), and Xenopus NIPA2 mRNAs. White letters on black background represent sequences conserved by comparison with the mammalian consensus, and black letters with gray background represent sequences conserved in fewer species, and italics represent chemically similar amino acids. GenBank accession numbers are as for fig. 4b, and the GenBank accession number for chicken is AJ452290.
Figure  4
Figure 4
NIPA1 and NIPA2 polypeptides. a, Amino acid alignment of NIPA1 orthologs in human, mouse, and Fugu. White letters with black background represent identical residues, black letters with light gray shading indicate conserved substitutions. Putative transmembrane (Tm) domains are designated by brackets, and the positions of exon (e)-intron boundaries are shown. GenBank accession numbers are as follows: human NIPA1, BK001020; mouse Nipa1, AY098645; and Fugu Nipa1 was predicted from genomic sequence (see the “Material and Methods” section). b, Amino acid alignment of NIPA2 orthologs from human (GenBank accession number BK001120), mouse (GenBank accession number BK001121), chicken (GenBank accession number AY099502), Xenopus (GenBank accession number BK001125), Fugu (predicted as for panel a), ancestral genes from Drosophila (GenBank accession number AE003637), Anopheles (predicted from GenBank accession number AAAB01008980), C. elegans (GenBank accession number AC006804), and a representative Arabidopsis homolog (GenBank accession number AY046035). c, Representative transmembrane helices based on hydrophobicity plots. d, Phylogenetic comparison of vertebrate NIPA1 and NIPA2 orthologs, ancestral invertebrate homologs, and a representative Arabidopsis homolog. The tree was constructed using CLUSTAL W, and branch lengths are proportional to sequence divergence. Each polypeptide is designated as the species, and the number 1 or 2 designates NIPA1 or NIPA2, respectively, except for ancestral members.
Figure  5
Figure 5
Imprinting assay of BP1–BP2 genes by RT-PCR in human and mouse. a, NIPA1, NIPA2, and GCP5 mRNA expression was examined in lymphoblast cell lines derived from a normal individual and from patients who have PWS (PWS-U) and AS (AS-J) with imprinting defects. An imprinted control gene, SNURF-SNRPN, shows paternal-only expression, as detected in the AS but not the PWS cell line. + = RT present; − = RT minus control. b, CYFIP1 imprinting analysis in families PWS-U and AS-J with imprinting defects and in somatic cell hybrids with a single maternal (Mat) or paternal (Pat) human chromosome 15. c, Nipa1, Nipa2, Cyfip1, Gcp5, imprinted control Snurf-Snrpn, and control Mkrn1 mRNA expression in mouse. Brain mRNA from wild-type (WT), or transgenic-deletion mouse models of PWS (TgPWS) and AS (TgAS) were used for RT-PCR. Mkrn1 is a nonimprinted control gene from mouse chromosome 6A (Gray et al. 2000). Paired lanes show reactions with (+) or without (−) reverse transcriptase.
Figure  6
Figure 6
Expression of BP1–BP2 genes in human and mouse tissues. a, Expression of human NIPA2 in various tissues by northern analysis, with β-ACTIN as a control. b, Constitutive expression of Nipa2 and brain-enriched expression of Nipa1 in mouse tissues by northern blot analysis, with Gapdh as a control. c, Expression of CYFIP1 in different human tissues and regions of brain, with SNURF-SNRPN or β-ACTIN as controls. d, Mouse Cyfip1 is widely expressed and enriched in placenta. Gapdh expression serves as a control. e, Human GCP5 is expressed at high levels in muscle and at lower levels in other tissues. f, Mouse Gcp5 is constitutively expressed in different tissues. In each case, radioactivity from each blot was stripped prior to successive hybridizations. B = brain; C = colon; Cl = cerebral cortex; Cm = cerebellum; F = frontal lobe; H = heart; K = kidney; Leu = peripheral blood leukocyte; Li = liver; Lu = lung; M = medulla; O = occipital lobe; Pa = pancreas; Pl = placenta; Pu = putamen; S = spinal cord; Si = small intestine; Sm = skeletal muscle; Sp; spleen; T = testis; Th = thymus; and Tl = temporal lobe.
Figure  7
Figure 7
Model for evolutionary transposition of BP1–BP2 genes by flanking duplicons. Genes are shown as horizontal arrows or arrowheads indicating the direction of transcription. Black arrows and white arrowheads represent nonimprinted and imprinted genes, respectively. HERC2 and duplicons (dup) derived from HERC2 are shown as gray arrows or bars when transcriptional direction is unknown. The rectangle indicates a putative transposition of a four- gene cassette with flanking HERC2-duplicons, in an ancestral primate. See text for further details. Not shown in this schematic is a cluster of three GABAA receptor genes and ATP10C, located between the UBE3A and P loci in human and mouse, nor additional duplicons that are interspersed with HERC2 duplicons but that are poorly characterized to date (see Nicholls and Knepper 2001).

References

Electronic-Database Information

    1. Biological Software, Institut Pasteur, http://bioweb.pasteur.fr/intro-uk.html (for the CLUSTAL W identity/similarity matrix program and the drawtree program to plot unrooted tree diagrams)
    1. Fugu BLAST Server, http://fugu.hgmp.mrc.ac.uk/blast/blast.cgi (for BLAST searches to identify the Fugu p, Herc2, Nipa1, Nipa2, Cyfip1, and Gcp5 gene orthologs)
    1. GenBank, http://www.ncbi.nlm.nih.gov/Genbank/ (for mouse Nipa1 cDNA [accession number AY098645], for chicken Nipa2 cDNA [accession number AY099502], for human NIPA1 cDNA [accession number BK001020], for human NIPA2 cDNA [accession number BK001120], for mouse Nipa2 cDNA [accession number BK001121], and for Xenopus Nipa2 cDNA [accession number BK001125])
    1. GeneMap '98, http://www.ncbi.nlm.nih.gov/genemap98/
    1. NCBI BLAST, http://www.ncbi.nlm.nih.gov/BLAST/ (for BLAST searches)

References

    1. Amos-Landgraf JM, Ji Y, Wayne G, Depinet T, Wandstrat SB, Daniel JD, Rogan PK, Schwartz S, Nicholls RD (1999) Chromosome breakage in the Prader-Willi and Angelman syndromes involves recombination between large, transcribed repeats at proximal and distal breakpoints. Am J Hum Genet 65:370–386 - PMC - PubMed
    1. Boccaccio I, Glatt-Deeley H, Watrin F, Roëckel N, Lalande M, Muscatelli F (1999) The human MAGEL2 gene and its mouse homologue are paternally expressed and mapped to the Prader-Willi region. Hum Mol Genet 8:2497–2505 - PubMed
    1. Buiting K, Korner C, Ulrich B, Wahle E, Horsthemke B (1999) The human gene for the poly(A)-specific ribonuclease (PARN) maps to 16p13 and has a truncated copy in the Prader-Willi/Angelman syndrome region on 15q11→q13. Cytogenet Cell Genet 87:125–131 - PubMed
    1. Buiting K, Saitoh S, Gross S, Dittrich B, Schwartz S, Nicholls RD, Horsthemke B (1995) Inherited microdeletions in the Angelman and Prader-Willi syndromes define an imprinting centre on human chromosome 15. Nat Genet 9:395–400 - PubMed
    1. Butler MG, Bittel DC, Kibiryeva N, Talebizadeh Z, Thompson T. Behavioral differences among subjects with Prader-Willi syndrome and type I and type II deletions and maternal disomy. Pediatrics, in press - PMC - PubMed

Publication types

MeSH terms