. 2003 Oct;110(2):197-205.
doi: 10.1046/j.1365-2567.2003.01723.x.

Selective regulation of CD40 expression in murine dendritic cells by thiol antioxidants

Affiliations

Selective regulation of CD40 expression in murine dendritic cells by thiol antioxidants

Norifumi Iijima et al. Immunology. 2003 Oct.

Abstract

Interaction of CD40 on dendritic cells (DC) with CD40 ligand induces interleukin-12 (IL-12) production by these DC during the antigen presentation. Thus, the level of CD40 expression appears to influence the capability of DC to induce a T helper 1 (Th1) response. However, it is not fully understood how CD40 expression on DC is regulated. In the present study, we examined the effects of the reducing agents, N-acetyl-l-cysteine (NAC) and reduced glutathione (GSH), on tumour necrosis factor-alpha (TNF-alpha)-induced phenotypic changes in murine DC. TNF-alpha markedly increased the expression on DC of major histocompatibility complex (MHC) and the costimulatory molecules, CD40, CD80 and CD86. Both NAC and GSH completely abolished the TNF-alpha-induced enhancement of CD40 expression, but had no considerable effect on the expression of CD80, CD86 and MHC. The marked decrease of CD40 protein with NAC was also detected by Western blotting, but was not associated with the expression level of CD40 mRNA in DC. Thus, NAC appears to reduce CD40 expression on DC by regulating a post-transcriptional pathway. The inhibitory effect of NAC or GSH on TNF-alpha-induced CD40 expression was released by simply removing these agents from the culture. In contrast, culture of TNF-alpha-treated DC with NAC or GSH markedly decreased the expression of CD40 within 12 hr. These results demonstrate that reducing agents selectively, rapidly and reversibly regulate CD40 expression on DC, which may eventually affect the capability of DC for Th1/Th2 polarization.


Figures
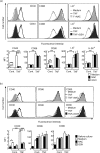
Figure 1
Figure 1
Effects of NAC and GSH on TNF-α-induced surface expressions of MHC and costimulatory molecules on murine DC. BC1 cells (a) and spleen-derived DC (SDDC) (b) were pretreated with NAC (20 mm) or GSH (20 mm) for 1 hr and then treated with TNF-α (40 ng/ml) for 24 hr in the presence of each agent. Cell-surface expressions of MHC and costimulatory molecules were analysed by flow cytometry. Representative FACS profiles [CD40, CD86 and I-Ad (a); CD40, CD86 and CD80 (b)] are shown (upper panel). Each column [CD40, CD86, CD80, I-Ad and H-2Kd (a); CD40, CD86 and CD80 (b)] represents the mean ± SE of at least three independent experiments (lower panel). Statistical significance was calculated by Scheffe's test (*P < 0·05; **P < 0·01; ***P < 0·001).
Figure 2
Figure 2
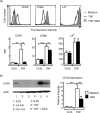
Effect of NAC on total amount of CD40 protein expressed on the cell surface and in the cytoplasm of BC1 cells. BC1 cells were pretreated with NAC (20 mm) for 1 hr and then treated with TNF-α (40 ng/ml) for 24 hr in the presence of NAC. (a) Flow cytometric analysis: the cells were fixed, permeabilized and stained with each specific mAb. The cell surface expressions were analysed by flow cytometry. Representative FACS profiles are shown (upper panel). Each column represents the mean ± SE of three independent experiments (lower panel). (b) Western blotting: the total cell lysate was subjected to Western blotting using specific antibody against CD40 or actin. B-cell lymphoma (A20) and human T-cell leukaemia (Jurkat) were used as positive and negative controls, respectively (left). The relative intensity of the specific band represents the ratio to the intensity of A20 (right). Each column represents the mean ± SE of three independent experiments. Statistical significance was calculated by the Scheffe's test (**P < 0·01; ***P < 0·001).
Figure 3
Figure 3
The effect of NAC on TNF-α-induced activation of ERK 1/2, p38mapk and SAPK/JNK. BC1 cells were pretreated with NAC (20 mm) for 1 hr and then treated with TNF-α (40 ng/ml) for 15 min in the presence of NAC. An in vitro kinase assay was performed using Elk-1, ATF-2, or c-Jun as a substrate for ERK 1/2 (a), p38mapk (b), or SAPK/JNK (c), respectively. Phosphorylation of Elk-1, ATF-2, or c-Jun was detected by Western blotting using antibodies against phospho–Elk-1, phospho–ATF-2, or phospho–c-Jun. Data are representative of three (a, b) or two (c) independent experiments (upper panel). Each column represents the mean ± SE of three (a, b) or two (c) independent experiments (lower panel).
Figure 4
Figure 4
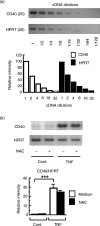
Effect of NAC on the level of CD40 mRNA expression. (a) Semiquantitative PCR of target cDNA using CD40- or HPRT-specific primer pair. Twofold dilutions of cDNA from BC1 cells treated with LPS (5 μg/ml) were amplified with CD40- or HPRT-specific primer-pair (upper panel). Relative intensity is shown (lower panel). (b) Effect of NAC on TNF-α-induced CD40 mRNA expression. BC1 cells were pretreated with NAC (20 mm) for 1 hr and then treated with TNF-α (40 ng/ml) for 10 hr in the presence of NAC. CD40 mRNA levels were analysed by RT-PCR. Data are representative of three independent experiments (upper panel). Each column represents the mean ± SE of three independent experiments (lower panel). Statistical significance was calculated by the Scheffe's test (***P < 0·001).
Figure 5
Figure 5
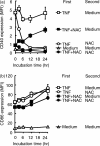
Time–course of CD40 and CD86 expressions in the presence or absence of NAC in the second culture. BC1 cells were treated with TNF-α (40 ng/ml) in the presence or absence of NAC (20 mm) for 24 hr (first culture). The cells were then washed and cultured with or without NAC for the indicated time (second culture). CD40 (a) and CD86 (b) expressions at the indicated time-point during the second culture were analysed by flow cytometry. Each symbol represents the mean ± SE of three independent experiments.

References

    1. Hart DN. Dendritic cells: unique leukocyte populations which control the primary immune response. Blood. 1997;90:3245–87. - PubMed
    1. Banchereau J, Steinman RM. Dendritic cells and the control of immunity. Nature. 1998;392:245–52. - PubMed
    1. Lane PJ, Brocker T. Developmental regulation of dendritic cell function. Curr Opin Immunol. 1999;11:308–13. - PubMed
    1. Lipscomb MF, Masten BJ. Dendritic cells. immune regulators in health and disease. Physiol Rev. 2002;82:97–130. - PubMed
    1. Van Kooten C, Banchereau J. CD40–CD40 ligand. J Leukoc Biol. 2000;67:2–17. - PubMed

Publication types

MeSH terms