. 2003 Oct;77(20):11125-38.
doi: 10.1128/jvi.77.20.11125-11138.2003.

Microarray profiling of antibody responses against simian-human immunodeficiency virus: postchallenge convergence of reactivities independent of host histocompatibility type and vaccine regimen

Affiliations

Microarray profiling of antibody responses against simian-human immunodeficiency virus: postchallenge convergence of reactivities independent of host histocompatibility type and vaccine regimen

Henry E Neuman de Vegvar et al. J Virol. 2003 Oct.

Abstract

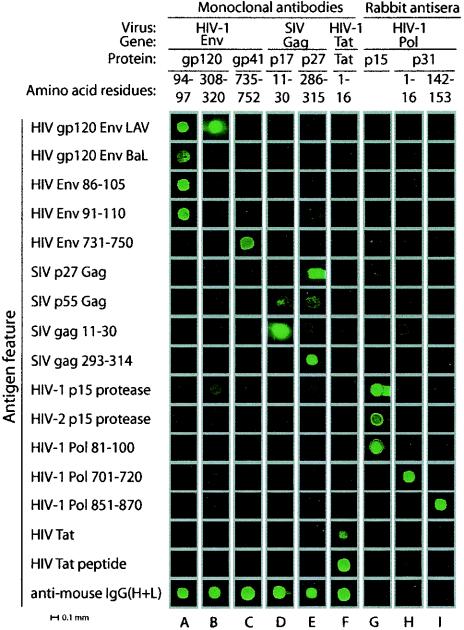
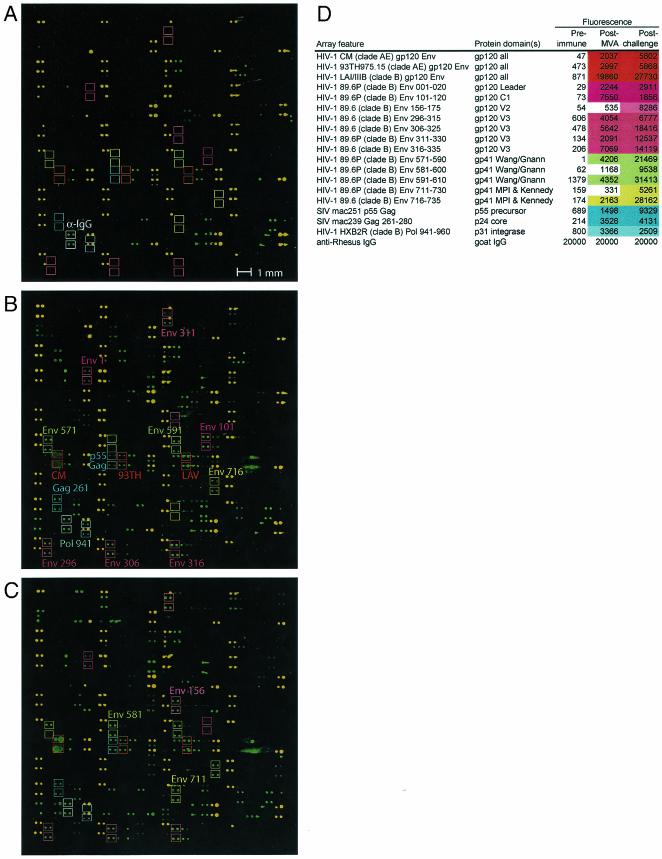
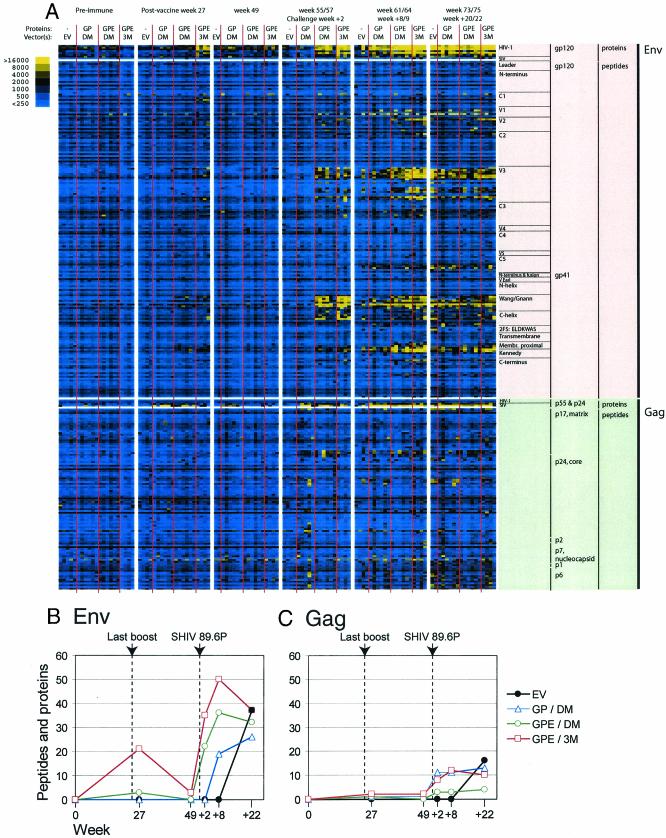
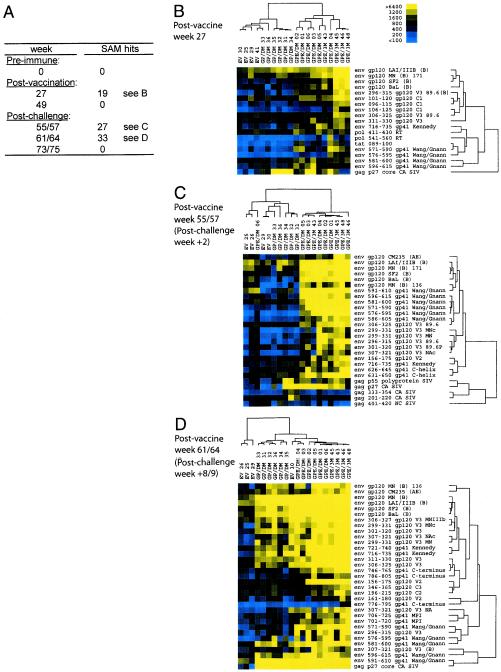
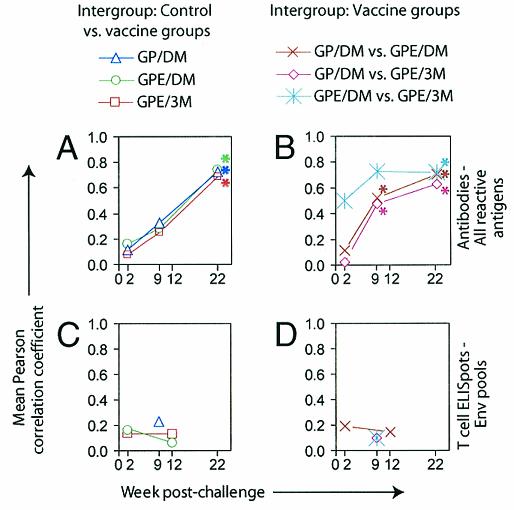
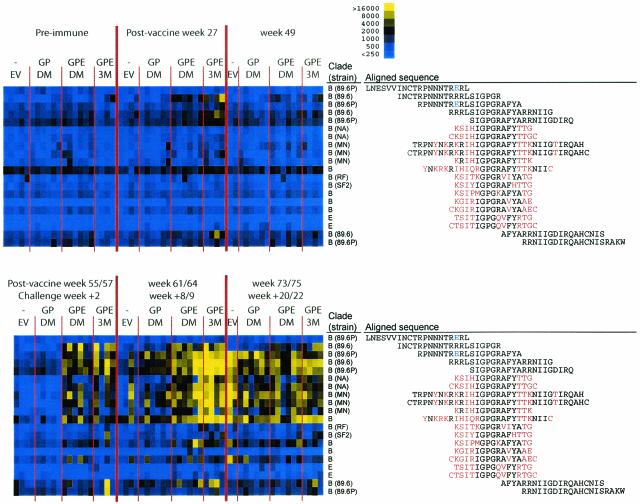
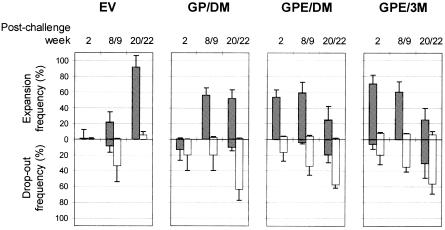
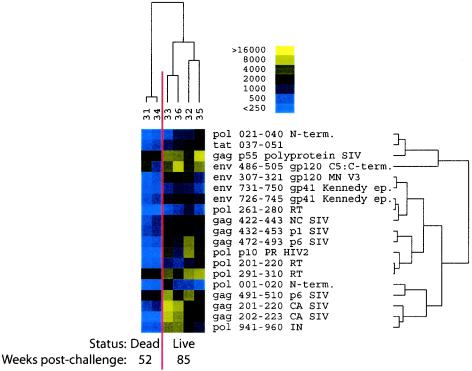
We developed antigen microarrays to profile the breadth, strength, and kinetics of epitope-specific antiviral antibody responses in vaccine trials with a simian-human immunodeficiency virus (SHIV) model for human immunodeficiency virus (HIV) infection. These arrays contained 430 distinct proteins and overlapping peptides spanning the SHIV proteome. In macaques vaccinated with three different DNA and/or recombinant modified vaccinia virus Ankara (rMVA) vaccines encoding Gag-Pol or Gag-Pol-Env, these arrays distinguished vaccinated from challenged macaques, identified three novel viral epitopes, and predicted survival. Following viral challenge, anti-SHIV antibody responses ultimately converged to target eight immunodominant B-cell regions in Env regardless of vaccine regimen, host histocompatibility type, and divergent T-cell specificities. After challenge, responses to nonimmunodominant epitopes were transient, while responses to dominant epitopes were gained. These data suggest that the functional diversity of anti-SHIV B-cell responses is highly limited in the presence of persisting antigen.


Figures

FIG. 1.
FIG. 1.
Validation of SHIV proteome arrays with specific sera and monoclonal antibodies. SHIV proteome arrays similar to those in Fig. 3 were incubated with monoclonal antibodies specific for HIV Env gp120 amino acids 94 to 97 and 308 to 320, HIV Env gp41 735 to 752, SIV Gag p17 11 to 30 and p27 286 to 315, and HIV Tat 1 to 16 or with rabbit antisera specific for HIV Pol p15 or p31 1 to 16 or 142 to 153 (as described in Table 1). Antigen features are indicated on the left, and each column of features is derived from a single array.
FIG. 2.
FIG. 2.
Comparison of antiviral antibody detection with microarrays and ELISA demonstrates concordant results. SHIV arrays were incubated with various concentrations of Env epitope-specific monoclonal antibodies (A). Array results are presented as normalized mean net digital fluorescence units (DFUs). Macaque samples were assayed by SHIV array and ELISA for anti-Env antibodies (B). Array results are presented as normalized median net DFUs, and ELISA results (7) as optical densities (O.D.).
FIG.3.
FIG.3.
The 2,304-feature SHIV proteome array. Ordered antigen arrays were generated by spotting 430 distinct SHIV- and HIV-derived peptides and proteins in four or eight replicate sets with a robotic microarrayer. Antibodies specific for macaque IgG (α−IgG) and antibodies labeled with Cy3 and Cy5 (yellow features), to serve as reference features to orient the arrays, were also spotted. Individual arrays (A to C) were incubated with prevaccination serum (week 0) (A), postvaccination prechallenge serum (week 27, 3 weeks after final boost) (B), or postchallenge serum (week 64, 9 weeks after challenge) (C), all derived from an individual macaque from the rMVA-only vaccine trial (group receiving three rMVA immunizations) (8). Bound antibodies were detected with indocarbocyanine-labeled goat anti-macaque IgG. Colored squares identify targets of anti-SHIV antibody responses induced by vaccination and challenge. Orange and yellow boxes demarcate reactivities against gp120 Env proteins from various strains of HIV and SIV, respectively, induced by vaccination. Dark red, pink, and light red boxes locate peptides from the amino-terminal, V2, and immunodominant V3 domains, respectively, of gp120 Env. Dark and light green boxes indicate reactivities to gp41 Env peptides from the immunodominant Wang/Gnann and Kennedy domains, respectively, detected initially after immunization and then more intensely after challenge. Blue boxes demarcate reactivities against HIV Gag p55 precursor protein and a p24 Gag peptide detected following immunization and challenge. Light blue boxes locate reactivities against a HIV p31 Pol (integrase) peptide. Antigen features measure approximately 200 μm in diameter. These 2,304-feature SHIV proteome arrays were used for all array experiments reported in this article. Quantitative analysis (D) of highlighted features from panels A to C is displayed. Median digital fluorescence units (DFUs), net of local background, were normalized to the net median DFU values for the anti-rhesus IgG features on each array. Antigen features with positive reactivity, defined as >1,400 DFUs, are highlighted in a color-matched fashion to the boxes outlining their corresponding antigen features in panels A to C.
FIG. 4.
FIG. 4.
Reactivity of macaque sera on SHIV proteome arrays: accelerated postchallenge antiviral antibody responses in vaccinated macaques. A false-color map (A) presents antibody reactivities detected against Env and Gag proteins and sequential overlapping peptides contained on SHIV proteome arrays. Time points and groups of animals are indicated along the top. Results from individual animals are represented in individual columns. Groups include vector-vaccinated (controls, EV), Gag-Pol-DNA-vaccinated and rMVA-boosted (GP DM), Gag-Pol-Env DNA-vaccinated and rMVA-boosted (GPE DM), and Gag-Pol-Env rMVA-primed and -boosted (GPE 3M) animals. Antigen features derived from Env and Gag are indicated along the right border, with proteins indicated first followed by overlapping peptides spanning each polypeptide. As indicated by the color key, blue represents lack of reactivity, black represents low reactivity, and yellow represents high reactivity. The average number of reactive Env (B) and Gag (C) features for macaques in each group was determined by pairwise SAM comparisons of macaques at the individual time points relative to their preimmune samples.
FIG.5.
FIG.5.
Evolution of anti-SHIV antibody responses postvaccination and postchallenge. Multiclass SAM analysis (A) was performed on SHIV proteome array results to identify the number of antigen features with statistically significant differences in reactivities at the indicated time points. (B to D) Hierarchical cluster analyses of SAM-identified antigen features at weeks 27, 55, and 64. Antigen features are indicated to the right of each panel, and individual macaques and their respective groups are indicated along the top. Dendrograms represent the hierarchical relationship between the individual macaques (dendrograms at top) and individual antigen features (dendrograms to right). Treatment groups are designated as in Fig. 4.
FIG. 6.
FIG. 6.
Postchallenge convergence of anti-SHIV antibody specificities but not T-cell specificities independent of vaccination regimen and macaque genotype. Pearson correlation coefficients were determined for antibody reactivities to all array reactive antigens (A and B) and for T-cell gamma interferon Elispot responses to pooled Env peptides (C and D). Mean Pearson correlation coefficients were plotted from pairwise comparisons between samples from the control group and each vaccine group (A and C) and between samples from different vaccine groups (B and D). For panels A and B, an antigen was classified as reactive if antibodies in at least one sample bound to it to generate a signal of >3,500 DFUs. Asterisks indicate time points with values that had statistically significant differences (P < 0.05) from postchallenge week 2 results, as determined by the Mann-Whitney test.
FIG. 7.
FIG. 7.
Reactivity of macaque sera against peptides from the V3 region of gp120: cross-reactivity to peptides containing a core GPGRAFY sequence. Treatment groups are designated as in Fig. 4. Amino acid residues shown in black are from the vaccine strain SHIV89.6; the distinct glutamic acid residue (E) of the challenge virus SHIV89.6P is indicated in blue; and the remaining divergent residues from other strains are shown in red. NA refers to a North American consensus sequence. Peptides that were not reactive to any serum (e.g., the first one listed) may not have bound to the slide or may not have been presented in an appropriate conformation.
FIG. 8.
FIG. 8.
Expansion and drop-out frequencies of reactivities to convergent and nonconvergent Env epitopes postchallenge. SAM analysis was performed on separate classes of epitopes: 24 convergent Env peptides listed in Table 3 (gray bars) and the remaining 162 nonconvergent Env peptides listed in Table 4 (open bars). Expansion frequency was defined as the number of newly positive epitopes within the specified class at the indicated time point (with new reactivity above 1,500 DFUs) divided by the number of negative epitopes within that class at the prior time point (with reactivity less than 1,500 DFUs), multiplied by 100%. Conversely, drop-out frequency was defined as the number of newly negative epitopes within the specified class (with reactivity falling below 1,500 DFUs) at the indicated time point divided by the number of positive nonconvergent epitopes within that class at the previous time points, multiplied by 100. Data are means ± standard error of the mean for individual monkeys within each treatment group. For designations of groups, see the legend to Fig. 4.
FIG. 9.
FIG. 9.
Survival is associated with increased breadth and intensity of anti-SHIV antibody responses. SAM analysis based on survival data was used to identify differences in anti-SHIV array reactivities in serum obtained at postchallenge week 22 between macaques in the Gag-Pol DNA/rMVA group that died of AIDS versus those that controlled their infections. Array data for antigens with significant differences in reactivity were subjected to hierarchical clustering.

References

    1. Abacioglu, Y. H., T. R. Fouts, J. D. Laman, E. Claassen, S. H. Pincus, J. P. Moore, C. A. Roby, R. Kamin-Lewis, and G. K. Lewis. 1994. Epitope mapping and topology of baculovirus-expressed HIV-1 gp160 determined with a panel of murine monoclonal antibodies. AIDS Res. Hum. Retrovir. 10:371-381. - PubMed
    1. Ahmad, A., and J. Menezes. 1996. Antibody-dependent cellular cytotoxicity in HIV infections. FASEB J. 10:258-266. - PubMed
    1. Alt, F. W., T. K. Blackwell, and G. D. Yancopoulos. 1987. Development of the primary antibody repertoire. Science 238:1079-1087. - PubMed
    1. Amara, R. R., and H. L. Robinson. 2002. A new generation of HIV vaccines. Trends Mol. Med. 8:489-495. - PubMed
    1. Amara, R. R., J. M. Smith, S. I. Staprans, D. C. Montefiori, F. Villinger, J. D. Altman, S. P. O'Neil, N. L. Kozyr, Y. Xu, L. S. Wyatt, P. L. Earl, J. G. Herndon, J. M. McNicholl, H. M. McClure, B. Moss, and H. L. Robinson. 2002. Critical role for Env as well as Gag-Pol in control of a simian-human immunodeficiency virus 89.6P challenge by a DNA prime/recombinant modified vaccinia virus Ankara vaccine. J. Virol. 76:6138-6146. - PMC - PubMed

Publication types

LinkOut - more resources