. 2003 Sep;114(3):1575-81.
doi: 10.1121/1.1603230.

The role of auditory feedback in sustaining vocal vibrato

Affiliations

The role of auditory feedback in sustaining vocal vibrato

Ciara Leydon et al. J Acoust Soc Am. 2003 Sep.

Abstract

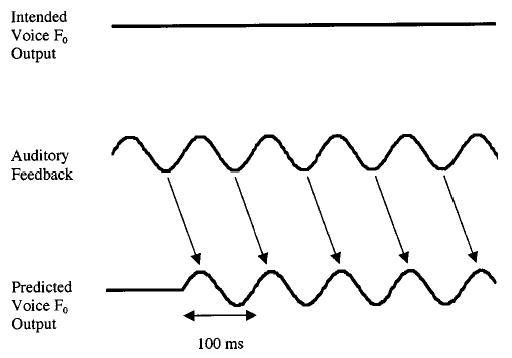
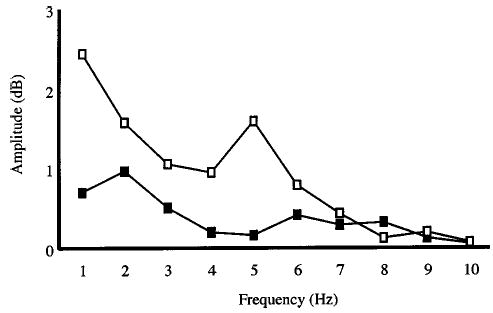
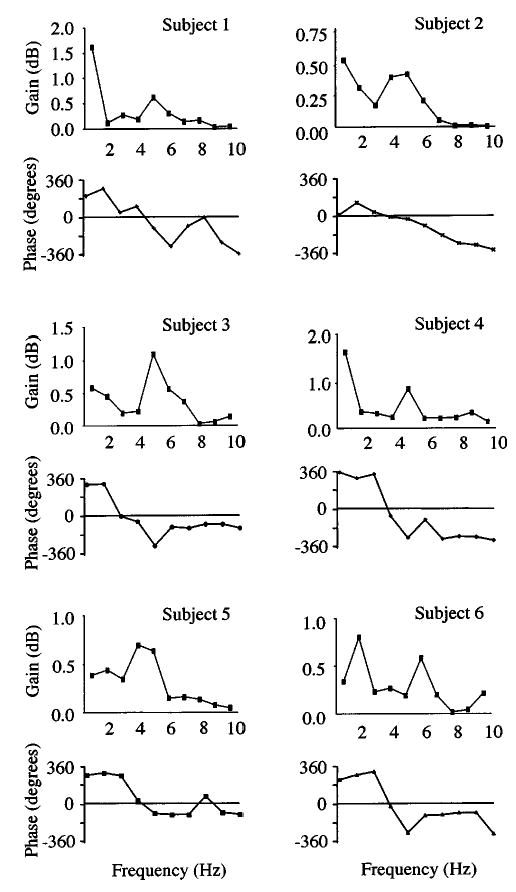
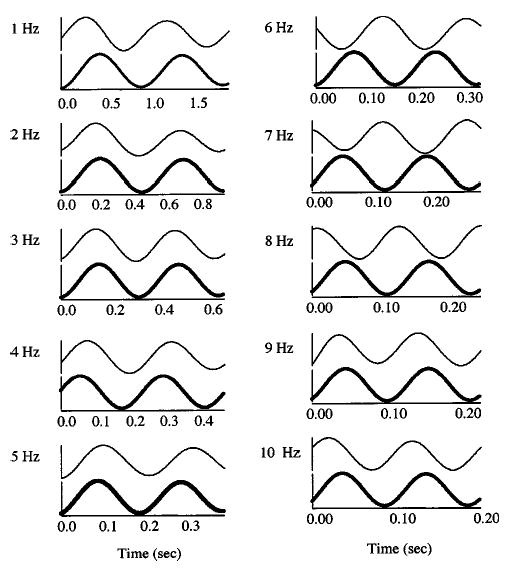
Vocal vibrato and tremor are characterized by oscillations in voice fundamental frequency (F0). These oscillations may be sustained by a control loop within the auditory system. One component of the control loop is the pitch-shift reflex (PSR). The PSR is a closed loop negative feedback reflex that is triggered in response to discrepancies between intended and perceived pitch with a latency of approximately 100 ms. Consecutive compensatory reflexive responses lead to oscillations in pitch every approximately 200 ms, resulting in approximately 5-Hz modulation of F0. Pitch-shift reflexes were elicited experimentally in six subjects while they sustained /u/ vowels at a comfortable pitch and loudness. Auditory feedback was sinusoidally modulated at discrete integer frequencies (1 to 10 Hz) with +/- 25 cents amplitude. Modulated auditory feedback induced oscillations in voice F0 output of all subjects at rates consistent with vocal vibrato and tremor. Transfer functions revealed peak gains at 4 to 7 Hz in all subjects, with an average peak gain at 5 Hz. These gains occurred in the modulation frequency region where the voice output and auditory feedback signals were in phase. A control loop in the auditory system may sustain vocal vibrato and tremorlike oscillations in voice F0.


Figures

FIG. 1
FIG. 1
Schematic illustration depicting the proposed manner in which the pitch-shift reflex can sustain vibratolike oscillations in voice fundamental frequency (F0). The upper trace shows the intended F0 contour (intended voice F0 output). The middle trace shows perceived F0 when real time auditory feedback is sinusoidally modulated at 5 Hz (auditory feedback). The lower trace depicts the expected F0 signal in response to modulations in auditory feedback (predicted voice F0 output). Decreases in perceived F0 result in compensatory increases in voice F0 with a 100-ms delay. Arrows indicate F0 responses following perceived decreases in auditory feedback F0. Conversely, increases in perceived F0 result in compensatory decreases in voice F0 also with a 100-ms delay. Arrows indicating voice F0 responses corresponding to perceived increases in F0 are omitted for clarity.
FIG. 2
FIG. 2
Long-time power spectra for a representative subject. The physiologic tremor curve (solid squares) depicts tremor present in the voice signal in the absence of modulated auditory input. Observed spectral peaks at 2 Hz and at 6 to 8 Hz indicate increases in physiologic tremor. The resonance curve (open squares) reflects the composite energy present in the voice signal during modulated auditory feedback. This curve shows a spectral peak at 5 Hz indicating natural resonance of pitch-shift reflex at this frequency. The spectral peak at 1 to 2 Hz may represent a voluntary response to modulated auditory feedback.
FIG. 3
FIG. 3
Transfer functions of gain (upper trace) and of phase (lower trace) for all subjects. The transfer functions of gain depict the amount of energy present in the voice signal relative to the energy present in the modulated auditory signal. Peak gains occurred at frequencies ranging from 4 to 7 Hz indicating that the pitch-shift reflex demonstrated greatest gain at frequencies consistent with vibrato. Low-frequency peaks observed in the transfer functions of each subject may have resulted from voluntary responses to modulated auditory feedback. The transfer functions of phase show the phase relationship between voice output and modulated auditory feedback signals. Voice output and auditory feedback signals were in-phase at frequencies between 3 and 5 Hz.
FIG. 4
FIG. 4
(a) Average transfer function of gain. Peak gain occurred at 5 Hz, which is consistent with peak gain in vibrato. The low-frequency peak at 1 to 2 Hz may have resulted from voluntary adjustment to pitch in response to modulated auditory feedback. (b) Average transfer function of phase. Voice output and modulated auditory feedback signals were in-phase at 4 Hz.
FIG. 5
FIG. 5
Time-aligned voice output signal (upper trace) and modulated auditory feedback signal (lower trace) at each modulation frequency (1 to 10 Hz) for a representative subject. Two cycles of modulated auditory feedback are shown at each modulation frequency. The signals are most in-phase at modulation frequencies from 3 to 5 Hz. Greatest amplitude of response occurred when the voice output and auditory feedback signals were most in-phase. The large amplitude responses observed at 1 to 2 Hz may have been due to voluntary adjustments in response to modulations in auditory feedback.

References

    1. Brown WS, Rothman HB, Sapienza CM. Perceptual and acoustic study of professionally trained versus untrained voices. J Voice. 2000;14:301–309. - PubMed
    1. Burnett TA, Larson CR. Early pitch-shift response is active in both steady and dynamic voice pitch control. J Acoust Soc Am. 2002;112:1058–1063. - PubMed
    1. Burnett TA, Senner JE, Larson CR. Voice F0 responses to pitch-shifted auditory feedback: A preliminary study. J Voice. 1997;11:202–211. - PubMed
    1. Burnett TA, Freedland M, Larson CR, Hain T. Voice F0 responses to manipulations in pitch feedback. J Acoust Soc Am. 1998;103:3153–3161. - PubMed
    1. Clarkson JK, Deutsch JA. Effect of threshold reduction on the vibrato. J Exp Psychol. 1966;71:206–210. - PubMed

Publication types