. 2003 Oct 14;100(21):12486-91.
doi: 10.1073/pnas.1934836100. Epub 2003 Sep 26.

Visual cortex is rescued from the effects of dark rearing by overexpression of BDNF

Affiliations

Visual cortex is rescued from the effects of dark rearing by overexpression of BDNF

Laura Gianfranceschi et al. Proc Natl Acad Sci U S A. .

Abstract

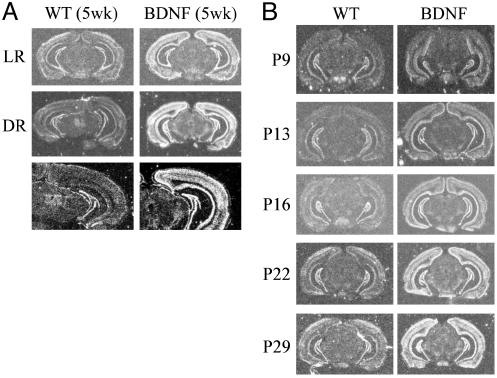
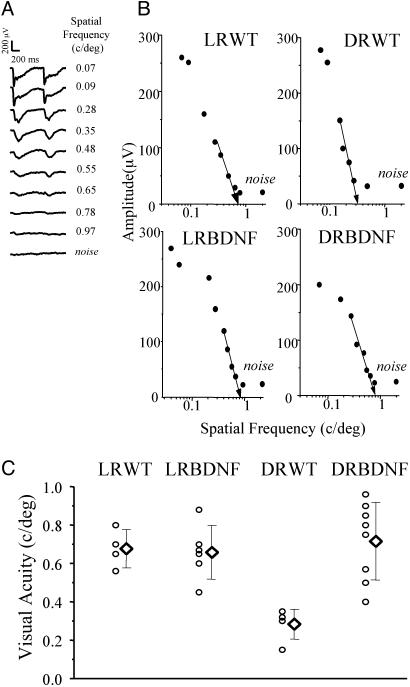
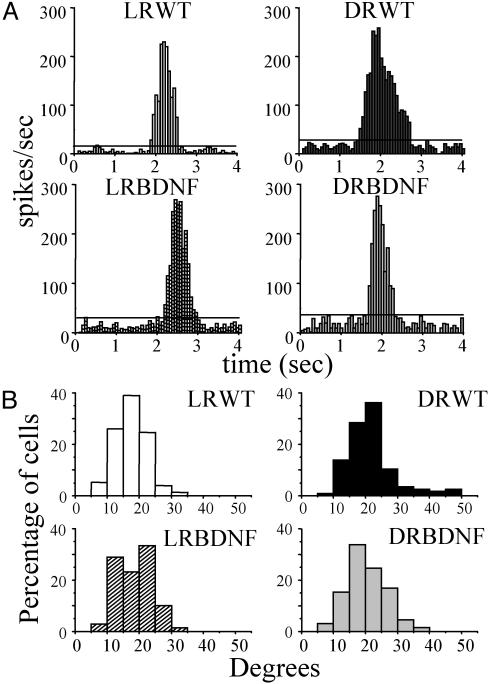
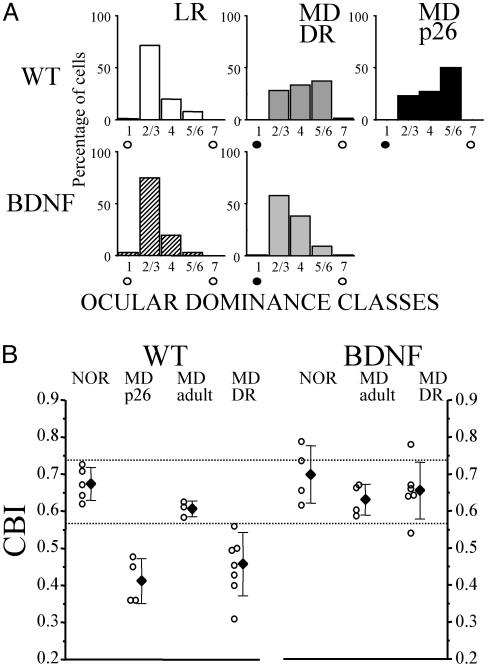
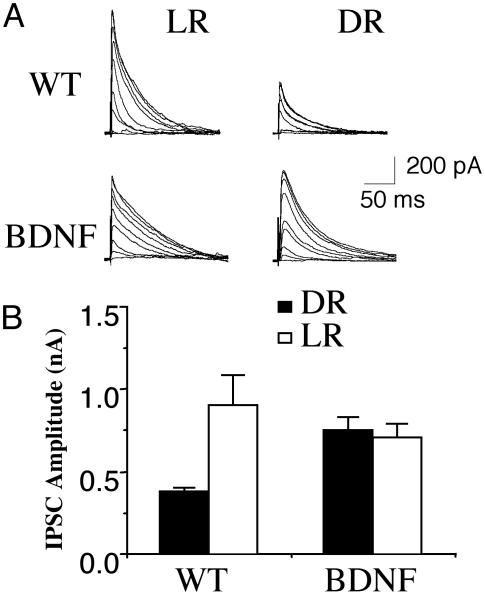
Visual deprivation such as dark rearing (DR) prolongs the critical period for ocular dominance plasticity and retards the maturation of gamma-aminobutyric acid (GABA)ergic inhibition in visual cortex. The molecular signals that mediate the effects of DR on the development of visual cortex are not well defined. To test the role of brain-derived neurotrophic factor (BDNF), we examined the effects of DR in transgenic mice in which BDNF expression in visual cortex was uncoupled from visual experience and remained elevated during DR. In dark-reared transgenic mice, visual acuity, receptive field size of visual cortical neurons, critical period for ocular dominance plasticity, and intracortical inhibition were indistinguishable from those observed in light-reared mice. Therefore, BDNF overexpression is sufficient for the development of aspects of visual cortex in the absence of visual experience. These results suggest that reduced BDNF expression contributes to retarded maturation of GABAergic inhibition and delayed development of visual cortex during visual deprivation.


Figures

Fig. 1.
Fig. 1.
(A) BDNF expression in visual cortex is down-regulated in wild-type but not in BDNF transgenic mice during DR. Coronal brain sections from 5-week-old wild-type (WT) and BDNF transgenic mice under light-rearing (LR) or DR conditions were hybridized with a BDNF oligonucleotide probe that detects both the endogenous and transgenic BDNF mRNA. (Bottom) Higher magnifications of DR cases. (B) Postnatal expression of BDNF in visual cortex of wild-type and BDNF transgenic mice.
Fig. 2.
Fig. 2.
Effects of DR on visual acuity of wild-type and BDNF transgenic mice. (A) Representative examples of VEPs in response to alternating gratings of different spatial frequencies in a wild-type mouse. VEP amplitudes decrease with increasing spatial frequency of stimulus. At spatial frequency of 0.65 cycles per degree, VEP amplitude is barely distinguishable from response to a blank field (noise). (B) Representative examples of VEP-extrapolated visual acuity for LRWT, light-reared (LR) BDNF, DRWT, and DRBDNF mice. Visual acuity is calculated by linear extrapolation (semilog coordinates) to 0 V of the set of data points close to the noise level. Maximal VEP amplitude was not significantly different among the mouse groups (one-way ANOVA, P = 0.13). (C) Mean visual acuity (diamonds) in DRWT mice (0.28 cycles per degree, SD = 0.08, five mice) is significantly reduced in comparison with that in LRWT mice (0.68 cycles per degree, SD = 0.10, four mice). On the other hand, mean visual acuity in DRBDNF mice (0.72 cycles per degree, SD = 0.20, eight mice) is not different from that in LRBDNF (0.66 cycles per degree, SD = 0.14, six mice) and LRWT mice. Error bars indicate SD.
Fig. 3.
Fig. 3.
Effects of DR on RF size in wild-type and BDNF transgenic mice. (A) Examples of peristimulus time histograms for cells recorded in primary visual cortex of LRWT, DRWT, and BDNF transgenic mice. Vertical stimulus bar, contrast 90%; velocity 28°/sec. Calculated RF sizes are: LRWT, 16.5°; DRWT, 32.5°; LRBDNF, 18.3°; DRBDNF, 14.75°. (B) RF size distribution for each group of mice. RFs were divided into 10 classes of 5° each, from 0° to 50°, and plotted as percentage of cells. Median RF size in DRWT (20.29°, 116 cells, eight mice) is significantly larger than that obtained in LRWT (16.80°, 77 cells, five mice; Kruskal–Wallis ANOVA, P < 0.05; post hoc Dunn's test, P < 0.05). On the other hand, median RF size in DRBDNF (18.50°, 65 cells, seven mice) is identical to that obtained in LRBDNF mice (18.44°, 69 cells, five mice).
Fig. 4.
Fig. 4.
Effects of DR on OD plasticity of wild-type (WT) and transgenic mice. DR prolongs the critical period of MD in wild-type but not in BDNF mice. (A) ODD was measured by dividing single units into five classes following the classification of Hubel and Wiesel (28). (Upper) In adult (P40) LRWT mice, ODD was strongly biased toward the contralateral eye (91 cells, five mice). MD during the peak of critical period (at P26, MDp26, 74 cells, four mice) but not in adult (88 cells, three mice) shifted ODD toward the open/ipsilateral eye. In DRWT mice, MD at adult age (P40) still shifted ODD toward the open/ipsilateral eye (MDDRWT, 153 cells, seven mice), indicating a delayed critical period by DR. (Lower) In adult (P40) LRBDNF mice, as in LRWT, ODD is also strongly biased toward the contralateral eye (67 cells, five mice). MD at adult age did not induce OD plasticity in LRBDNF mice (77 cells, four mice). In DRBDNF mice, however, MD at adult age (P40) still did not induce OD shift toward the open/ipsilateral eye (MDDRBDNF, 153 cells, seven mice), indicating normal closure of the critical period. (B) Results in A are quantified by calculating the CBI (see Materials and Methods). In LRWT mice, binocular visual cortex is dominated by contralateral eye (meanCBI = 0.67, SD = 0.04); MD at P26 induced OD shift (meanCBI = 0.41, SD = 0.06); MD at adult age had no effect on ODD (meanCBI = 0.61, SD = 0.03). In DRWT, MD even at adult age induced OD shift (meanCBI = 0.45, SD = 0.08). In LRBDNF mice, contralateral eye input is also dominant (meanCBI = 0.67, SD = 0.04); MD at adult age had no effect on ODD (meanCBI = 0.63, SD = 0.04). In DRBDNF mice, however, MD at adult age remains ineffective in inducing OD shift (meanCBI = 0.66, SD = 0.02).
Fig. 5.
Fig. 5.
Normal development of intracortical inhibition in DRBDNF transgenic mice. (A) IPSCs in layer 2/3 pyramidal neurons evoked by a layer 4 stimulus series with increasing intensities of 5, 7.5, 10, 15, 20, 30, 40, 80, and 160 μA. These responses were recorded from visual cortical slices of age-matched wild-type (WT) (Upper) and BDNF transgenic (Lower) mice reared either normally (Left, LR) or in the dark (Right, DR). (B) Average amplitude of the maximal IPSCs recorded in layer 2/3 pyramidal neurons from visual cortical slices of LRWT, DRWT, and BDNF transgenic mice. Error bars indicate SE.

References

    1. Boothe, R. G., Dobson, V. & Teller, D. Y. (1985) Annu. Rev. Neurosci. 8, 495-545. - PubMed
    1. Fagiolini, M., Pizzorusso, T., Berardi, N., Domenici, L. & Maffei, L. (1994) Vision Res. 34, 709-720. - PubMed
    1. Blakemore, C. & van Sluyters, R. C. (1975) J. Physiol. (London) 248, 663-716. - PMC - PubMed
    1. Fregnac, Y. & Imbert, M. (1978) J. Physiol. (London) 278, 373-377. - PMC - PubMed
    1. Sherman, S. M. & Spear, P. D. (1982) Physiol. Rev. 62, 738-855. - PubMed

Publication types

LinkOut - more resources