. 2003 Oct 1;22(19):4968-79.
doi: 10.1093/emboj/cdg498.

Single-molecule imaging of cooperative assembly of gamma-hemolysin on erythrocyte membranes

Affiliations

Single-molecule imaging of cooperative assembly of gamma-hemolysin on erythrocyte membranes

Vananh T Nguyen et al. EMBO J. .

Abstract

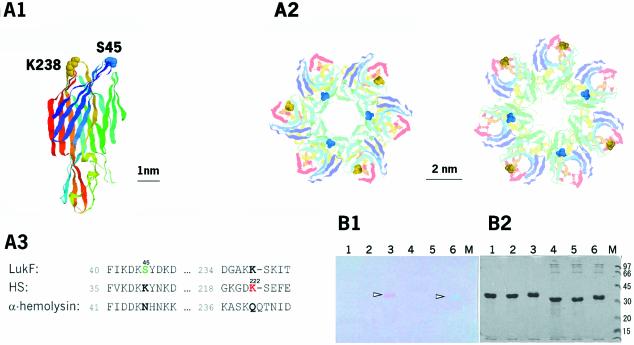
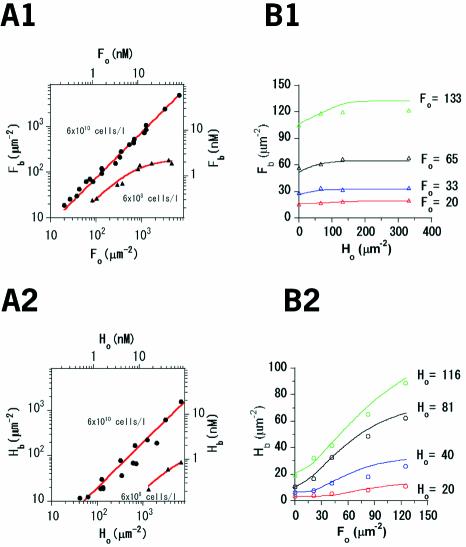
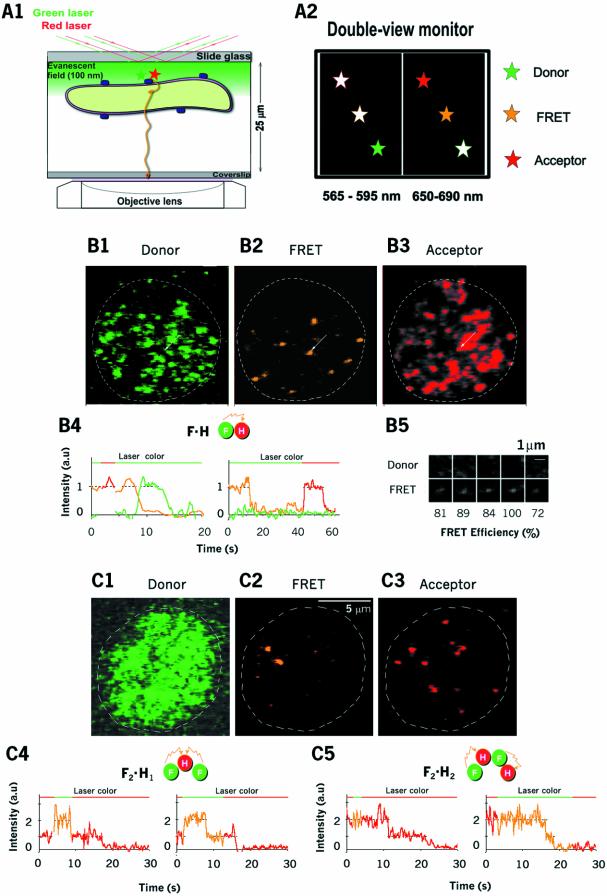
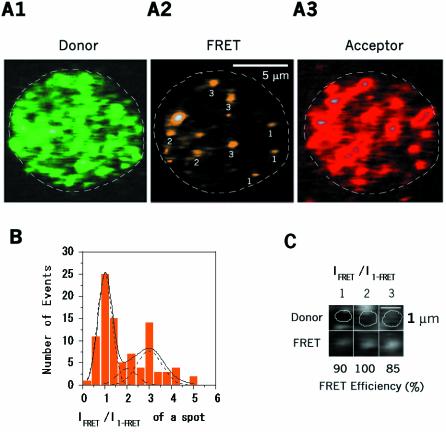
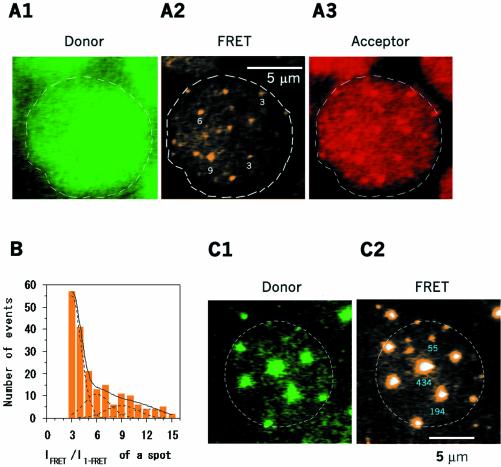
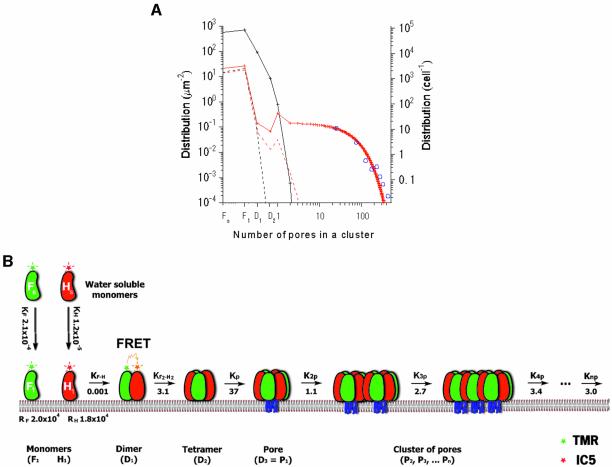
Single-molecule fluorescence imaging was used to investigate assembly of Staphylococcus aureus LukF and HS monomers into pore-forming oligomers (gamma-hemolysin) on erythrocyte membranes. We distinguished the hetero-oligomers from the monomers, as indicated by fluorescence resonance energy transfer between different dyes attached to monomeric subunits. The stoichiometry of LukF (donor) and HS (acceptor) subunits in oligomers was deduced from the acceptor emission intensities during energy transfer and by direct acceptor excitation, respectively. Based on populations of monomeric and oligomeric intermediates, we estimated 11 sequential equilibrium constants for the assembly pathway, beginning with membrane binding of monomers, proceeding through single pore oligomerization, and culminating in the formation of clusters of pores. Several stages are highly cooperative, critically enhancing the efficiency of assembly.


Figures

None
Fig. 1. Structures and labeling of LukF and HS. (A) S45 (blue) of LukF and K222 (yellow) of HS (corresponding to K238 of LukF) were mutated to Cys, shown using the LukF structure (A1), the modelled γ-hemolysin complex in hexamers or heptamers (A2), and the amino acid sequence alignment between LukF, HS, and α-hemolysin (A3). (B) SDS–PAGE gels of 10 µg of fluorescently labeled proteins, unstained (B1) and stained (B2) with Coomassie brilliant blue. Samples included: lane 1, LukF treated with TMR-maleimide; lane 2, LukF-S45C; lane 3, LukF–TMR (arrowhead); lane 4, HS treated with IC5-maleimide; lane 5, HS-K222C; and lane 6, HS–IC5 (arrowhead).
None
Fig. 2. Membrane binding of LukF and HS. (A) Binding of LukF–TMR (A1) or HS–IC5 (A2). [Fb] or [Hb] were plotted against [Fo] or [Ho] at 6 × 10¹⁰ (filled circles) and at 6 × 10⁸ (filled triangles) HRBC/l. The red lines represent the fitting of data (Appendix 1). (B) Binding of both LukF–TMR and HS–IC5 to 6 × 10¹⁰ HRBC/l. At four values of [Fo] (B1) and [Ho] (B2), the relative [Fb] and [Hb] were measured in the presence of the other at different concentrations. The lines represent theoretical values of Fb (Hb), calculated based on the binding and association constants.
None
Fig. 3. Visualization of small oligomers of LukF and HS. (A) Arrangement of the TIRF microscope for observation of oligomerization on the membranes (A1). Fluorescence signals near the basal membrane appeared on the double-view monitor: the left is for the donor, the right is for FRET and the acceptor (A2). (B and C) Images of dimers formed by LukF–TMR and HS–IC5 on HRBC membranes at low concentrations of proteins (75 and 750 pM, respectively) (B1–B3), and at higher concentrations of LukF–TMR (300 pM) and lower HS–IC5 (200 pM) (C1–C3). TMR, FRET and IC5 signals are shown after excitation by the green laser (B1 and B2; C1 and C2; time 0), and by the red laser (B3 and C3; time 0), respectively. B4 shows time traces of TMR (green), FRET (orange) and IC5 (red) emission corresponding to dimers (F·H = LukF–TMR HS–IC5). The left trace (eight frame-averaged) indicates that IC5 photobleaches first, and the right trace (30 ms interval) indicates that TMR photobleaches first. Five images of dual signals of TMR and FRET acquired from the same spots (B5). Thirty millisecond interval time traces of acceptor emission on anticorrelated excitation by the green and red lasers for short (∼3 s) or long times (>10 s), showing trimers (F2·H1; C4) and tetramers [(F·H)2; C5).
None
Fig. 4. Visualization of intermediate oligomers and single pores. LukF–TMR and HS–IC5 were incubated with HRBC at intermediate concentrations of 400 pM and 4 nM, respectively. (A) TMR (A1; time 0), FRET (A2; time 0) and IC5 signals (A3; time 44 s) are on the same cell. White numbers on A2 indicate m in Fm·Hn. (B) Population histogram of intermediate oligomers: the dashed and solid lines indicate Gaussian distribution peaks for F·H, (F·H)2, F3·H3–4 and for the total population, respectively. (C) Three images of dual signals of TMR and FRET-IC5, showing single and multi-molecule FRET efficiencies between LukF–TMR and HS–IC5 in dimers and larger oligomers.
None
Fig. 5. Visualization of clusters of pores. LukF–TMR and HS–IC5 were incubated with HRBC at high concentrations of 1.5 and 15 nM (A), or of 15 and 150 nM (C), respectively. LukF–TMR and HS–IC5 were excited by two lasers at 25% power (A), and at 2.5% power (C), compared to that used for single FRET observation. TMR (A1 and C1) and FRET (A2 and C2) signals show clusters of pores scattered on the membranes. IC5 signals (A3) are on the same cell with A1, A2. White numbers on A2 indicate m in Fm·Hn. Blue numbers on C2 indicate the number of pores in each large spot. (B) Histogram of populations of Fm·Hn corresponding to single pores and groups of pores at 15% hemolysis. The dotted and solid lines indicate Gaussian distribution peaks at single, two, three and four pores, and the total population, respectively.
None
Fig. 6. Simulations and models for pore assembly. (A) Experimental and theoretical distribution of intermediates at given protein concentrations (Knp is assumed to be ∼K3p or K4p). The blue circles were measured from 237 spots of data (as for Figure 5C), and were fitted by the theoretical red line. The dotted and solid lines represent theoretical distributions at [Fo] and [Ho] of 25 and 1000 µm–2, respectively. The red lines represent a fully cooperative process, similar to natural conditions. The black lines represent non-cooperative processes (K of all stages are ∼KF·H). (B) Cartoon model for pore assembly of LukF and HS. Water-soluble LukF (green) and HS (red) monomers bind to putative binding sites on the membranes. Sequentially, the membrane-bound monomers assemble into small oligomers (e.g. dimers and tetramers), then into single pores and clusters of pores. The pore is represented as a hexamer, although formation of hexameric and/or heptameric pores is possible. The FRET signals indicate oligomers. The blue lines indicate the transmembrane domains inserting through lipid bilayers upon pore formation. The numbers indicate equilibrium binding and association constants (µm2).

References

    1. Alberts B., Alexander,J., Lewis,J., Raff,M., Roberts,K. and Walter,P. (2002) Protein. In Albert,B. (ed.), Molecular Biology of the Cell, 4th edn. Garland Science, New York, NY, pp. 147–162.
    1. Alberts B., Alexander,J., Lewis,J., Raff,M., Roberts,K. and Walter,P. (2002) The cytoskelton. In Albert,B. (ed.), Molecular Biology of the Cell, 4th edn. Garland Science, New York, NY, pp. 907–915.
    1. Comai M. et al. (2002) Protein engineering modulates the transport properties and ion selectivity of the pores formed by staphylococcal γ-hemolysins in lipid membranes. Mol. Microbiol., 44, 1251–1267. - PubMed
    1. Daugherty M.A., Brenowitz,M. and Fried,M.G. (1999) The TATA-binding protein from Saccharomyces cerevisiae oligomerizes in solution at micromolar concentrations to form tetramers and octamers. J. Mol. Biol., 285, 1389–1399. - PubMed
    1. Deniz A.A. et al. (1999) Single-pair fluorescence resonance energy transfer on freely diffusing molecules: observation of Forster distance dependence and subpopulations. Proc. Natl Acad. Sci. USA, 96, 3670–3675. - PMC - PubMed

Publication types